
Daymet cross-validation information for year 2017 is now available. These datasets report either the station-level daily weather observation data and the corresponding Daymet model predicted data or the annual summary cross-validation statistics for three Daymet parameters: minimum temperature (tmin), maximum temperature (tmax), and daily total precipitation (prcp).
Station-Level Inputs and Model Predicted Values
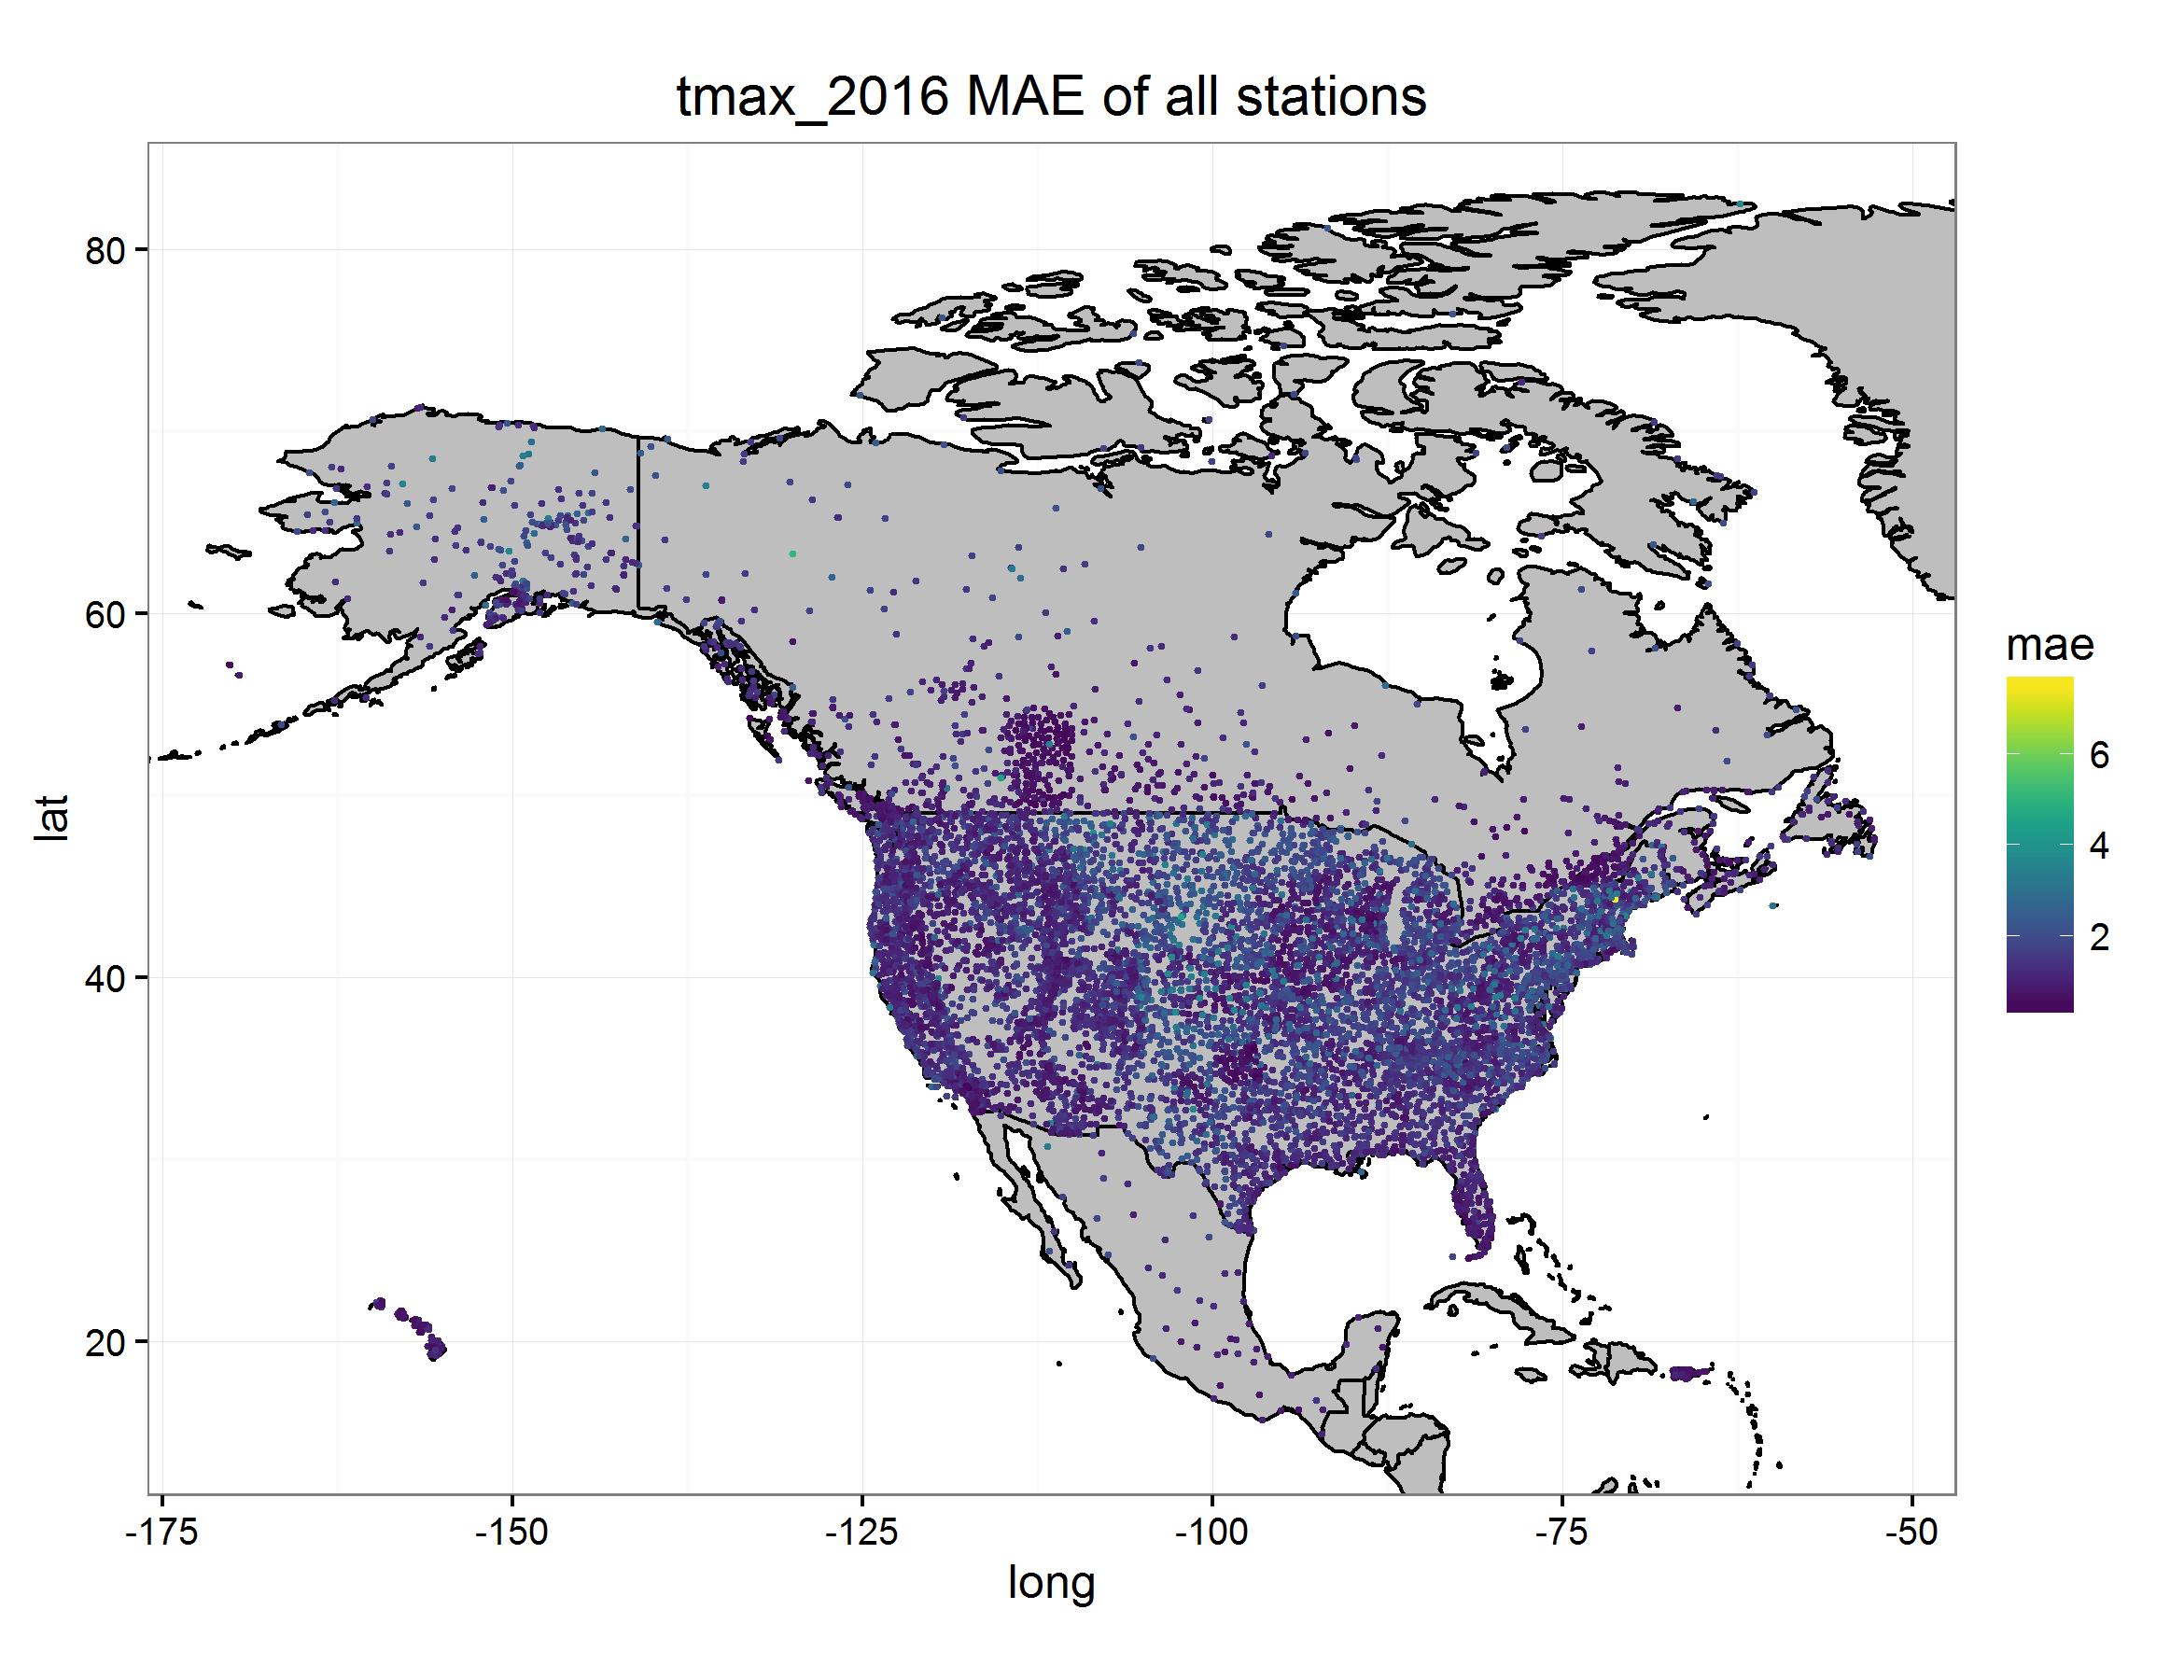
Station-level daily weather observation data and the corresponding Daymet model predicted data are provided for stations across North America. Also included are corresponding station metadata files for each variable and year, including the station name, station identification, latitude, and longitude. Regression statistics and mean absolute error can be derived using the provided companion file R code to assess temporal and spatial patterns of uncertainty.
Annual Tile Summary Cross-Validation Statistics
The tile-level cross-validation statistics were generated by the Daymet model algorithm from the station-based daily observations and predictions and are summarized for each of the 2-degree by 2-degree tiles across North America. Also available are tile-wide values of number of ground weather stations evaluated, total station-days evaluated, and mean observed input parameter values.
Data Citations:
Thornton, M.M., P.E. Thornton, Y. Wei, R.S. Vose, and A.G. Boyer. 2018. Daymet: Station-Level Inputs and Model Predicted Values for North America, Version 3. ORNL DAAC, Oak Ridge, Tennessee, USA. https://doi.org/10.3334/ORNLDAAC/1391
Thornton, P.E., M.M. Thornton, and R.S. Vose. 2018. Daymet: Annual Tile Summary Cross-Validation Statistics for North America, Version 3. ORNL DAAC, Oak Ridge, Tennessee, USA. https://doi.org/10.3334/ORNLDAAC/1348
Data Center: ORNL DAAC
Sponsor: NASA EOSDIS
