Body
Monthly estimates of ocean surface pCO2 and air-sea flux of CO2 are available from NASA's Carbon Monitoring System.

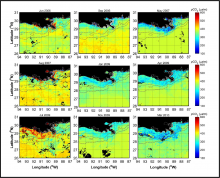
Monthly composite images of satellite-derived pCO2 for the northern Gulf of Mexico, corresponding to each of the cruises for which observational data were acquired. Black pixels in the images correspond to areas that were masked (e.g., land, clouds), and the dotted lines represent the 45 and 200 m isobaths.
Monthly estimates of ocean surface pCO2 and air-sea flux of CO2 are available from NASA's Carbon Monitoring System.

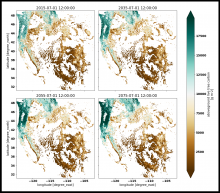
Annual estimates of aboveground live tree carbon (g/m2) as simulated with the Community Land Model (4.5) at 1/24-degree (4 km x 4 km) resolution.
The North American Carbon Program provides new, annual, estimated forest carbon budgets for the Western USA from 1979 to 2099.

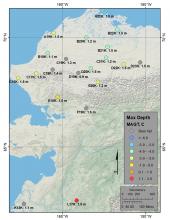
USArray measurement sites in Alaska. Sites are labeled with site ID and maximum measurement depth and color-coded by mean annual ground temperature (MAGT in degrees C) of the deepest sensor measurements. Data are omitted for sites disrupted by bears.
Soil temperature data were collected at Alaskan USArray seismic monitoring sites from 2016-2018.

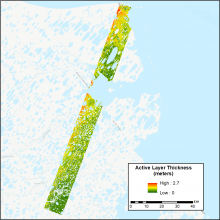
Active layer thickness product (ALT) at 30 m resolution near Barrow (Utqiagvik), Alaska.
New data from NASA's Arctic-Boreal Vulnerability Experiment (ABoVE) provide estimates of active layer thickness from airborne radar.


The ATom aircraft prepares to depart from Punta Arenas in southern Chile on October 14, 2017. During ATom-3, the science team flew over Antarctica and below the ozone hole before continuing on their journey north over the Atlantic Ocean to Greenland and returning to California.
Data collected by the Aerosol Microphysical Properties (AMP) instrument during the Atmospheric Tomography (ATom) Mission is now available.

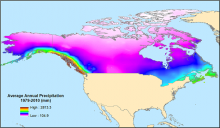
Average annual precipitation for 1979-2010 at 0.25 degree resolution across the Arctic Boreal Vulnerability Experiment study domain.
Estimated historical water balance climatologies are available for the Arctic-Boreal Vulnerability Experiment (ABoVE) study domain.

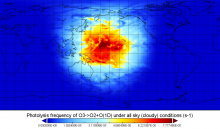
An image of photolysis frequency (J-value) for J-O1D under cloudy conditions from the GSFC GMI model.
Atmospheric photolytic rates for ozone and nitrogen dioxide were estimated using nine global chemistry-climate or chemistry-transport models.

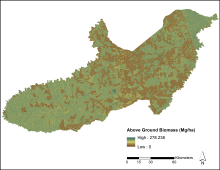
Assimilated predictions of forest aboveground biomass across the Paragominas Municipality, Brazil.
Estimates of forest aboveground biomass for the Paragominas municipality, in Para, Brazil, were derived from LiDAR and PALSAR data.

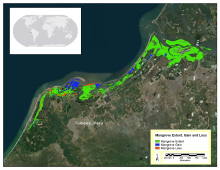
Map of a portion of Peruvian coast showing areas of mangrove extent, gain, and loss from the year 2000 to 2016.
Maps of mangrove forest extent and change is available for river deltas in six countries: Gabon, Jamaica, Mozambique, Peru, Senegal, and Tanzania.

Near-daily CubeSat imagery was collected within four large regions across the ABoVE study area. Timeseries of lake area were derived from the CubeSat imagery for more than 80,000 lakes in these regions.
Near-daily CubeSat imagery provides information on the seasonal dynamics of more than 80,000 lakes.
