CARVE: Net Ecosystem CO2 Exchange and Regional Carbon Budgets for Alaska, 2012-2014
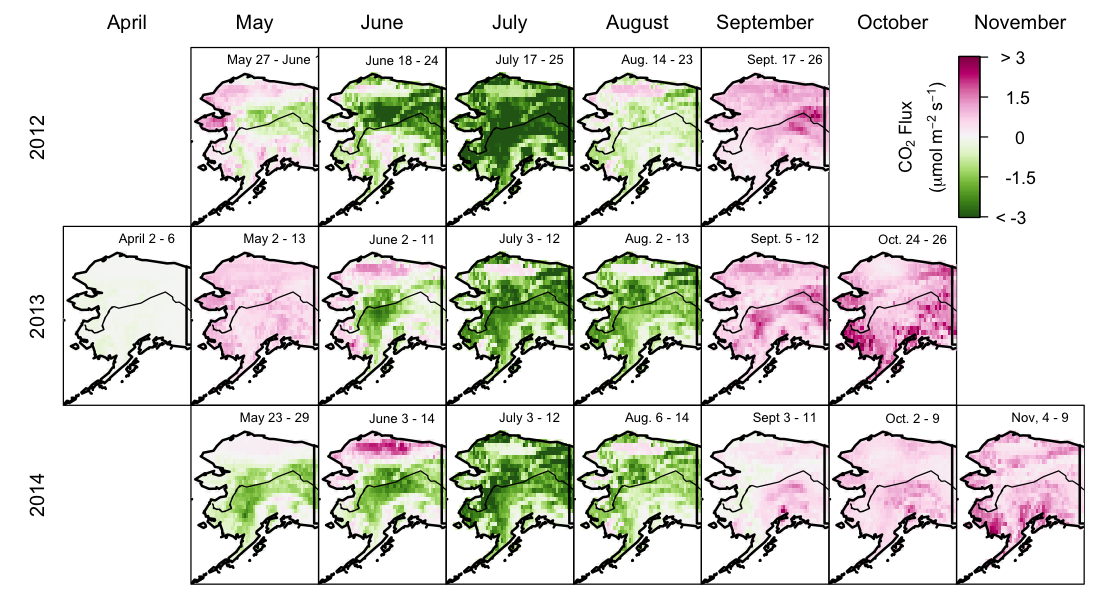
This data set provides estimates of 3-hourly net ecosystem CO2 exchange (NEE) at 0.5-degree resolution over the state of Alaska for 2012-2014. The NEE estimates are the output are from Geostatistical Inverse Modeling of a subset of CARVE aircraft CO2 data, WRF-STILT footprints, and PVPRM-SIF data from flux towers (CRV: located in Fox, AK and BRW: located just outside Barrow, AK). Daily mean NEE is also provided as calculated for all of Alaska and for four sub-regions (0.5-degree resolution) that were defined across Alaska, based on general landcover type: North Slope Tundra, South and West Tundra, Boreal Forests, and Mixed (all other). Also provided are derived annual carbon budgets for (1) all of Alaska with defined contributions from biogenic, fossil fuel, and biomass burning sources and (2) annual biogenic carbon budgets for the four landcover-type regions of Alaska. Provided for completeness are the CARVE aircraft atmospheric measurement data used in estimating NEE.
Related Publication
Commane, R., et al. 2017. Carbon dioxide sources from Alaska driven by increasing early winter respiration from Arctic tundra. Proceedings of the National Academy of Sciences. https://doi.org/10.1073/pnas.1618567114
Data Acknowledgements
Data authors: Commane, R., J. Benmergui, J.O.W. Lindaas, S. Miller, K.A. Luus, R.Y-W. Chang, B.C. Daube, S. Euskirchen, J. Henderson, A. Karion, J.B. Miller, N.C. Parazoo, J.T. Randerson, C. Sweeney, P. Tans, K. Thoning, S. Veraverbeke, C.E. Miller, and S.C. Wofsy.
Data Set DOI: http://dx.doi.org/10.3334/ORNLDAAC/1389
Data center: ORNL DAAC
Sponsor: NASA EOSDIS


