Daymet V3: Annual Tile Summary Cross-Validation Statistics for North America, Hawaii
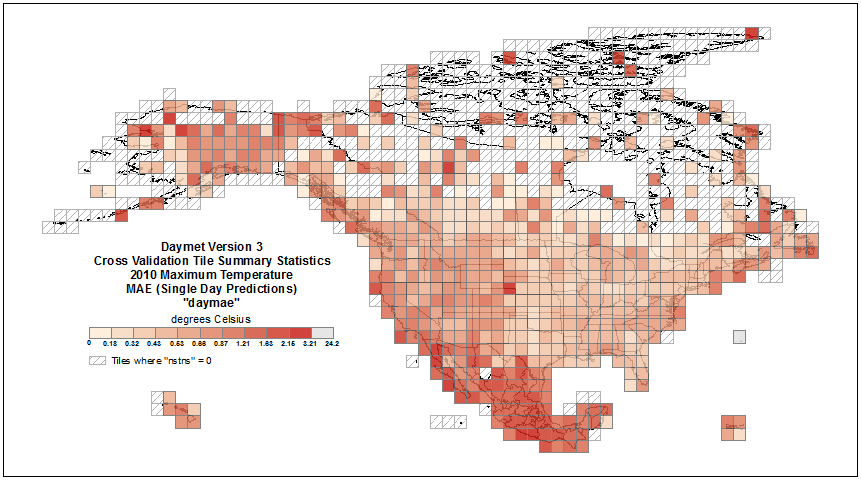
This data set provides annual summary cross-validation statistics for minimum temperature (tmin), maximum temperature (tmax), and daily total precipitation (prcp) of "Daymet: Daily Surface Weather Data on a 1-km Grid for North America, Version 3" (Thornton et al., 2016). The cross-validation statistics were generated by the Daymet model algorithm from the station-based daily observations and predictions and are summarized for each of the 2-degree by 2-degree tiles in the regimen in which Daymet is derived. Data are available for the temporal period 1980 through 2015, the most recently processed calendar year of Daymet Version 3. Summarized by tile are average and period-of-record mean absolute error (MAE) and bias statistics for the input weather observations of tmin, tmax, and prcp. Also available are tile-wide values of number of ground weather stations evaluated, total station-days evaluated, and mean observed input parameter values. Summary statistics are also available for the Gaussian distribution functions, used in the Daymet interpolation method, as mean and standard deviations of the radius of the kernel weights and x, y, and z components of the 3-dimensional regression formula.
Data Acknowledgements
Data Authors: Thornton, P.E., M.M. Thornton, and R.S. Vose.
Data Set DOI: http://dx.doi.org/10.3334/ORNLDAAC/1348
Data center: ORNL DAAC
Sponsor: NASA EOSDIS


