
The circumpolar taiga-tundra ecotone (TTE) is the Earth's longest vegetation transition zone, stretching for more than 13,400 km around Arctic North America, Scandinavia, and Eurasia. This transition between taiga, or boreal forest, and tundra is particularly sensitive to climate change, making it an important focus area for looking at the causes and consequences of climate change. Measuring and monitoring the shifting of tree lines along the TTE are therefore critical to understanding the effects of climate change in the north.
A recent paper by K.J. Ranson, et al. (2011), "Object-based mapping of the circumpolar taiga-tundra ecotone with MODIS tree cover", addresses these questions and looks at tree cover. The paper was published in "Remote Sensing of the Environment" and the resulting data is archived at the ORNL DAAC.
The objective of the study was to define the taiga-to-tundra transition zone at the northern edge of the circumpolar boreal forest to provide a benchmark for subsequent studies. The taiga-tundra ecotone was delineated using an image-segmentation-based mapping approach with multi-annual MODIS Vegetation Continuous Fields (VCF) tree cover data.
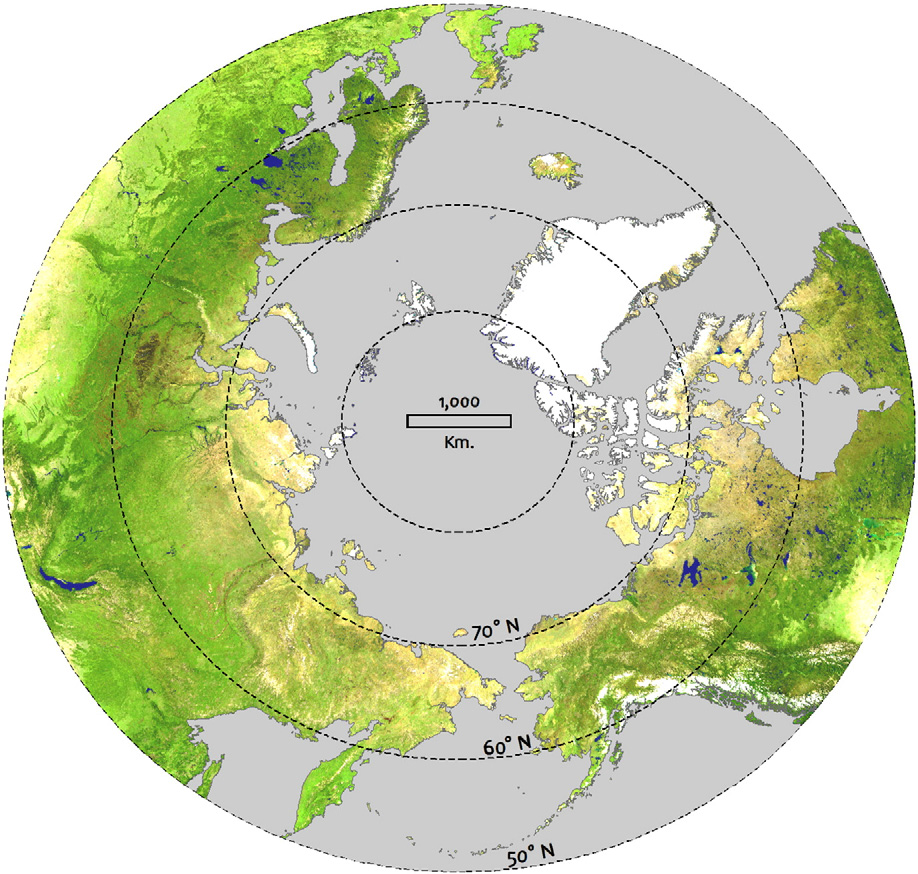
The resulting map of Tree Canopy Cover for the Circumpolar Taiga-Tundra Ecotone: 2000-2005 is archived at the ORNL DAAC. This data set provides a map of tree canopy cover over the circumpolar taiga-tundra ecotone (TTE) from 50°N to 70°N in North America and from 60°N to 70°N in Eurasia. Canopy cover was derived from the 500-meter MODIS Vegetation Continuous Fields (VCF) product as averaged over six years from 2000-2005 and processed as described in Ranson et al. (2011). This process identified patches of low tree canopy cover which are indicative of the transition from forest to tundra.
This TTE map can be a used in a number of ways. First, it can be included in global models that require forest extent information for the high northern latitudes. The map provides an explicit, area-based northern edge of most of the boreal forest/taiga. Second, when used as a mask, the map identifies areas of sparse forest patches across a broad scale where researchers may expect rapid and variable vegetation
changes to occur at forest fronts. The TTE is derived from 500 m pixels, a spatial resolution appropriate to measuring/mapping global phenomena, but perhaps too large to serve to monitor vegetation changes that take place on the scale of kilometers over decades. As such, the TTE map may be employed in data integration/fusion studies to target areas that have high potential for change and areas that should be studied with finer resolution radar and lidar data to measure forest patch- and gap-level 3-D vegetation structure.
Study and Data Set Authors: K.J. Ranson, P.M. Montesano, and R. Nelson
Article: Object-based mapping of the circumpolar taiga-tundra ecotone with MODIS tree cover
Get Data: Circumpolar TTE map

