Body
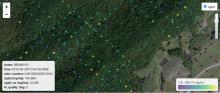
L2A unrectified surface reflectance images from NASA's AVIRIS-NG instrument.

Portion of quicklook image for AVIRIS-NG flight ang20220228t214527 over Ventura County north of Santa Clara River west of Filmore, California on 28 February 28 2022 (Source: ang20220228t214527_geo.jpeg).
GEDI Beam 101 shot number 24610500300213454 illustrating aboveground biomass.
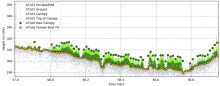
ATL08 data visualized along-track (100m step size), showing the estimated ground elevation, estimated canopy top height, and the individual photon return heights with their classifications. Image credit: Amy Neuenschwander, Center for Space Research, University of Texas.
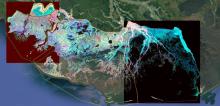
RGB composite image of the Atchafalaya and Terrebonne basins (R=Bathymetry, G=NIR of 1st quarter, B=NIR of 3rd quarter) highlighting the various ecological and geomorphological features of the landscape.
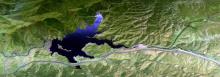
RGB composite MASTER image from data collected during the SARP campaign over Pyramid Lake, California, USA on 2009-07-24. Image derived from bands 12, 10, 9 spanning visible to near-infrared wavelengths.
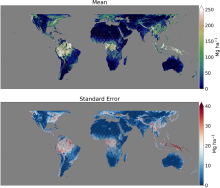
Gridded mean aboveground biomass density (top) and standard error of the mean (bottom).
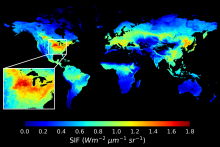
Global map of daily mean Solar Induced Fluorescence (SIF) for July 2010 at 0.05 degree resolution. The USA's Corn Belt (insert) showed the largest SIF emission during the growing Season (Image Credit: Jiaming Wen 2022).
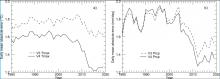
Annual timeseries of daily cross-validation mean absolute error (MAE), averaged over all station days for each year, comparing results for Daymet V4 and Daymet V3. (a) MAE for estimation of daily maximum temperature. (b) MAE for estimation of daily total precipitation. Image from Thornton et al. 2021.
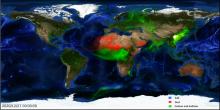
An example of aerosols (Salt, Dust, and Carbon and Sulfates) modeled by the Goddard Earth Observing System Version 5 (GOES-5) on 12/27/2020, image source NASA.
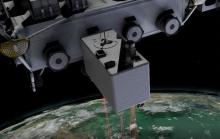
The Global Ecosystem Dynamics Investigation (GEDI) instrument provides high resolution laser ranging of Earth's forests and topography from the International Space Station (ISS).