Body
Selected aerosol and gas-phase observations made on all four deployments of NASA Atmospheric Tomography Mission (ATom).

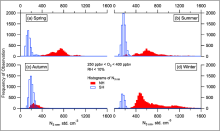
Histograms of the total number of aerosols between 3 and 4500 nm in the LMS (ozone 250-400 ppbv, altitude > 8 km) for the SH and NH) for all ATom deployments (a-d), by season. Modified from fig. 2 of Williamson et al. (2021).
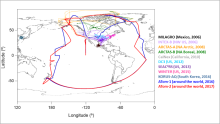
Flight tracks for airborne campaigns in this dataset.
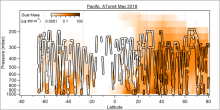
Dust mass observations across the Pacific Ocean made by the PALMS instrument combined with AMP aerosol size spectrometers during the ATom-4 campaign in May 2018.
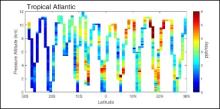
Curtain plot for production of ozone from the ATom-1 campaign in the Atlantic. The 10 s air parcels are averaged into 10-degree latitude and 200 m altitude bins. Reactivities, such as P-O3, are calculated for each 10 s air parcel from the Modeling Data Stream (MDS), Version 2, using the UC Irvine chemistry-transport model (CTM) with HNO4 and PAN damped by thermal decomposition.
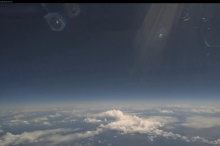
View from the front of the NASA DC-8 aircraft during the ATom-1 campaign.
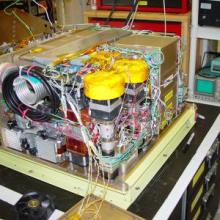
Photo of the interior of the PANTHER GC. This instrument was used during all ATom campaigns.
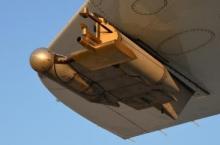
The CAPS instrument attached to the exterior of the NASA DC-8 aircraft.
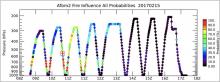
Fire influences for air parcels on the ATom-2 research flight that occurred on 2017-02-15.
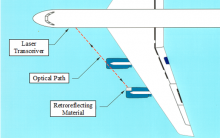
Figure 1. Location of external path DLH on DC-8 (typical port-side installation).
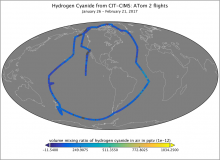
Figure 1. Measurements of Hydrogen Cyanide from the CIT-CIMS instrument collected during ATom-2 flights.