Body
1-second aerosol extinction and absorption measurements from the SOAP instrument during the 2018 ATom-4 campaign.

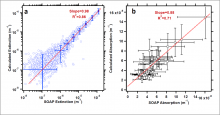
Figure 1. (a) Aerosol extinction calculated using Mie theory from composition-resolved size distributions plotted as a function of measured extinction from the SOAP cavity ring-down spectrometer during the ATom-4 campaign, showing representative error bars. (b) Calculated aerosol absorption and measured absorption from the SOAP photoacoustic spectrometer for cases when absorption >2 *10-6 m-1 (2x the detection limit).
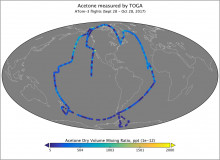
Measurements of atmospheric acetone concentration from samples collected by the Trace Organic Gas Analyzer (TOGA) during ATom-3 flights in 2017.
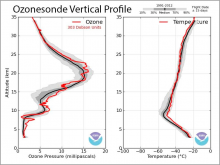
Example of a vertical profile created from Ozonesonde and radiosonde instruments. Source: https://gml.noaa.gov/ozwv/ozsondes
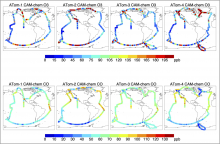
CAM-chem simulated concentrations of ozone (O3) and carbon monoxide (CO) along ATom flight tracks.
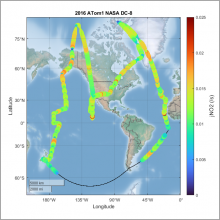
CAFS derived total NO2 photolysis frequencies (jNO2) during ATom 1. The flight track (black line) is shown during nighttime operations when jNO2 is below detection limits.
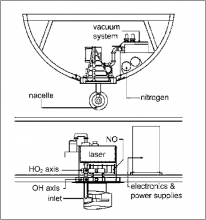
A schematic of ATHOS looking from in front of the electronics rack (top) and from the DC-8 aircraft's port side (bottom).

NASA's DC-8 flying laboratory. All four ATom campaigns were conducted with DC-8.
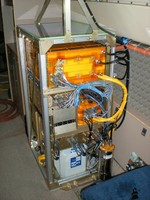
The Harvard QCLS (DUAL and CO2) instrument package contains two optical assemblies, calibration and common data systems, and power supply.
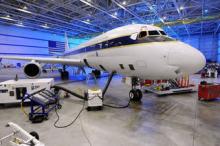
Photo of NASA's DC-8 flying laboratory.
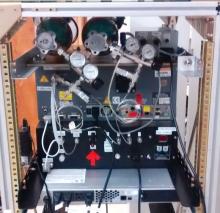
The forward-facing side of the NOAA Picarro G2401 instrument used on the four ATom campaigns.