Body
Modeled meteorological conditions and tagged-CO tracer concentrations along ATom flight paths.

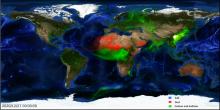
An example of aerosols (Salt, Dust, and Carbon and Sulfates) modeled by the Goddard Earth Observing System Version 5 (GOES-5) on 12/27/2020, image source NASA.
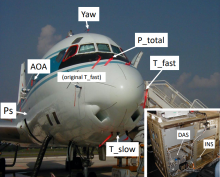
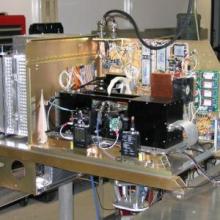
MMS instrumentation on the DC-8 aircraft during the fourth field campaign in the NASA Convection and Moisture Experiment (CAMEX) series.
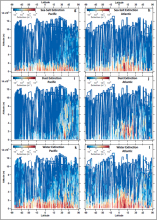
Aerosol extinction across ATom campaigns. Sea salt is shown in (g) and (h), dust in (i) and (j), and water in (k) and (l). Source: Brock et al., 2021
Generalized overview of ATom flights.
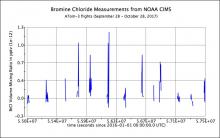
Bromine chloride measurements from the NOAA CIMS instrument during the ATom-3 campaign.
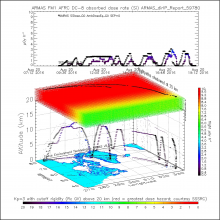
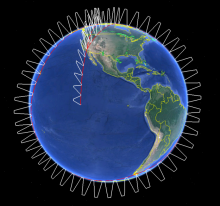
Absorbed dose rate in silicon (top panel) and the 3D representation of the flight (bottom panel). The colored region above 20 km is the notional hazards of the incoming particle environment at the top of the atmosphere, where red indicates greater hazard (more particle flux) at the high latitudes while green represents lower hazard (lower particle flux and lower radiation exposure) in the equatorial region.
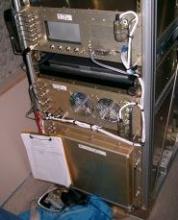
The NOAA Single Particle Soot Photometer (SP2) instrument.
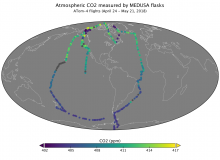
Collection locations of atmospheric carbon dioxide concentration from flasks collected by the Medusa system during ATom-4 flights in 2018.
The AO2 instrument used to collect airborne Oxygen and Carbon Dioxide measurements on HIPPO flights from 2009 through 2011.
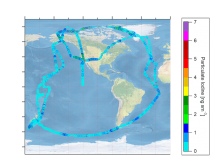
Particulate iodine measured along flight paths in ATom1 and ATom2. Image by J.L. Jimenez
Reanalysis of initial High-Resolution Aerosol Mass Spectrometer measurements of global oceanic coverage of particulate iodine are now available.