Body
If you missed our recent Webinar on subsetting remote sensing data, a new ORNL DAAC Learning Resource provides access at your convenience.

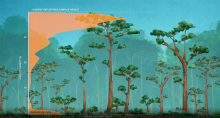
GEDI Beam 101 shot number 24610500300213454 illustrating aboveground biomass.
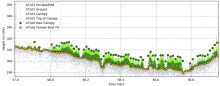
ATL08 data visualized along-track (100m step size), showing the estimated ground elevation, estimated canopy top height, and the individual photon return heights with their classifications. Image credit: Amy Neuenschwander, Center for Space Research, University of Texas.
NASA's GEDI observable is the lidar waveform, all products are derived from it.

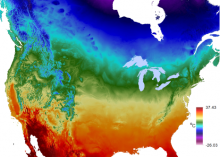
Average maximum temperature for a 24-hour period over an annual period.
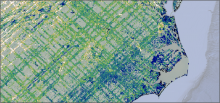
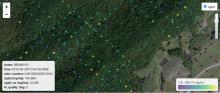
This screen capture from the GEDI L4B mean aboveground biomass density layer shows the crisscross pattern of GEDI's laser tracks on the Earth's terrestrial surface.
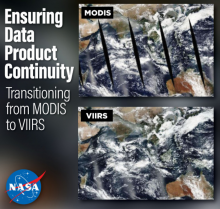
Transitioning from MODIS to VIIRS to ensure data product continuity. Image Credit: NASA ESDIS Outreach Team.
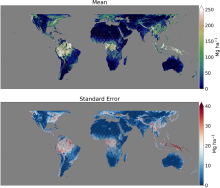
Gridded mean aboveground biomass density (top) and standard error of the mean (bottom).
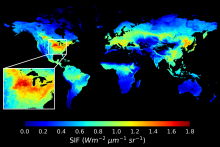
Global map of daily mean Solar Induced Fluorescence (SIF) for July 2010 at 0.05 degree resolution. The USA's Corn Belt (insert) showed the largest SIF emission during the growing Season (Image Credit: Jiaming Wen 2022).