Body
Global gridded information on lake surface area and open water CH4 emissions for an annual climatology representative of the average conditions from 2003 to 2015.

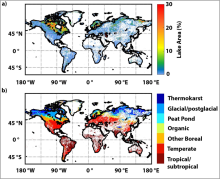
a) Lake area density (fraction of cell area) and b) ecoclimatic lake type classification. White space indicates cells with no lakes present.
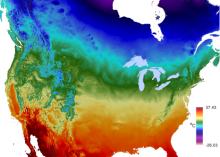
Average maximum temperature for a 24-hour period over an annual period.
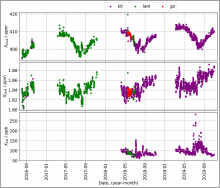
Time-series of ground-based column-averaged dry air mole fractions of CO2 (xco2), CH4 (xch4), and CO (xco).
Average maximum temperature for a 24-hour period over an annual period.
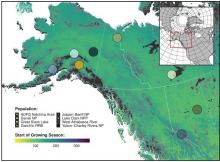
Spatial distribution of eight wolf study populations used in an assessment (from 2000-2017) of denning phenology in response to climate signals. The base map shows the day of the year representing the NDVI-derived start of the growing season in 2010.

Dr. Peter Thornton studies the interactions of land ecosystems with other components of the Earth's climate system including biogeochemical and physical land-atmosphere feedbacks, and interactions with human systems.
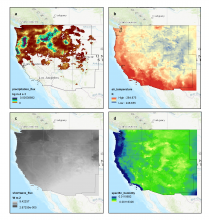
Four variables for the same 3-hour timestep, December 8, 2015, 12:00 AM to 3:00 AM, a) precipitation flux (kg m-2 s-1) b) air temperature (K) c) shortwave radiation flux (W m-2) d) specific humidity. Source: western_USA_precipitation_3hr_2015-12.nc4
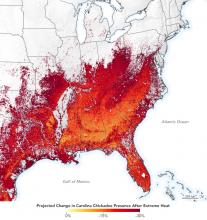
After a week of extreme heat, the Carolina Chickadee was less present, compared to normal weather conditions. Image credit: NASA's Earth Observatory
Daymet data were used to investigate how bird species respond to extreme weather conditions throughout eastern North America.

A digital rendering shows the instruments and associated equipment that will be included on board the PACE spacecraft. Credit: NASA GSFC.
Registration is now open for the first NASA Plankton, Aerosol, Cloud, ocean Ecosystem Mission (PACE) Applications Virtual Workshop.
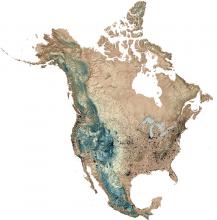
Each black dot on this digital elevation map (DEM) represents a surface weather station in continental North America providing Daymet data in 2010. Additional stations providing Daymet data are located in Puerto Rico and Hawaii.
Daymet derived annual average of daily minimum temperature, 1980 (left) and 2019 (right), for a subset of North America. Images are scaled from -20 to +20 degrees C.