Body
Estimates of forest disturbance intensity for the conterminous United States from 1986 to 2015.

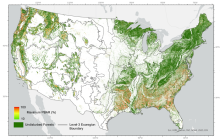
Forest disturbance intensity 1986 - 2015. This time-integrated map represents the percentage of basal area removal (PBAR) value, regardless of the disturbance year, for pixel locations where only one disturbance event was detected. The maximum PBAR is shown for locations that were disturbed multiple times.
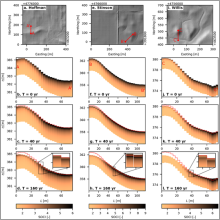
Hillslope transects at three sites showing redistribution of soil organic carbon (SOC) simulated over 160 years in Iowa. Sites (columns): Hoffman, Stinson, and Willis. Upper row shows hillshade maps illustrating topography at each site. Red lines show location of transects proceeding from upslope to downslope (e.g., A to A'). Lower three rows illustrate pattern of SOC along the transect distance (L) at soil depths at beginning of simulation (0 y), after 40 y, and at end of simulation (160 y). Red lines indicate the initial surface elevation at beginning of simulation. Insets highlight cases where soil with low SOC blankets soil with higher SOC.
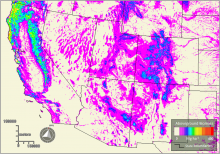
Generalized 2005 MISR-derived AGB map for the southwestern U.S., one in the series for 2000-2021.
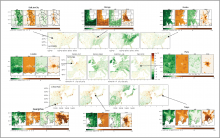
The sums of seasonal mean SMUrF-based NEE and ODIAC-based FFCO2 for CONUS (a), western Europe (b), and East Asia (c) for 2018 in centered panels. City-wide GEE, Reco, NEE, and FFCO2 over JJA 2018 are provided around the centered panels.
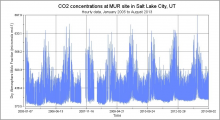
Carbon dioxide concentrations at the MUR site in Salt Lake City, Utah, show a pronounced seasonal pattern of higher CO2 in the winter months.
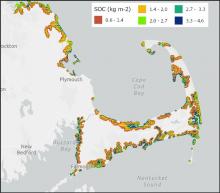
Predicted soil organic carbon (SOC) content of wetlands at 0-5 cm depth in the vicinity of Cape Cod, Massachusetts, U.S. Estimates represent the period 1998-2018 and were derived from publicly available data sources using a quantile regression forest model.
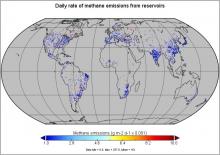
Estimated rate of methane emissions from inland reservoirs for July 15. Spatial resolution is 0.25 degrees. Source: Data file reservoir_methane_emissions.nc
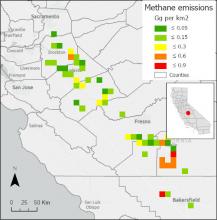
Total methane emissions from dairy farms in the central valley of California, USA, in 2019.
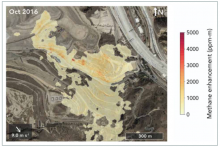
The AVIRIS-NG instrument detected large methane plumes coming from Sunshine Canyon Landfill during its October 2016 overpass. The plumes are shown in a yellow to red gradient, with red representing higher concentrations of methane. Image credit: Cusworth et al. 2020.
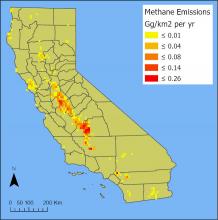
Total annual methane emissions in 2019 from dairy farms in California. These values represent the sum of emissions from enteric fermentation and manure management practices. Units are Gg per square kilometer per year. Source: total_CH4_CA_2019.tif