Body
The ORNL DAAC hosted a workshop during the 7th NACP Open Science Meeting on March 24.

The North American Carbon Program (NACP) is a multidisciplinary research program designed to improve understanding of North America's carbon sources, sinks, and stocks.
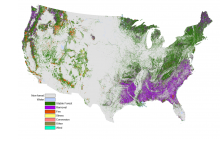
North American Forest Dynamics (NAFD) attribution type layer illustrating the type of change event where all events from 1986-2010 were combined. Source: Schleeweis et al. (2020) https://doi.org/10.3334/ORNLDAAC/1799
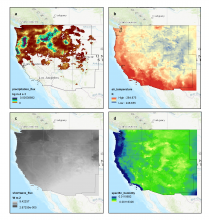
Four variables for the same 3-hour timestep, December 8, 2015, 12:00 AM to 3:00 AM, a) precipitation flux (kg m-2 s-1) b) air temperature (K) c) shortwave radiation flux (W m-2) d) specific humidity. Source: western_USA_precipitation_3hr_2015-12.nc4
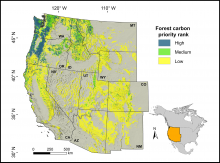
Forested land in the western conterminous United States classified by priority for preservation to mitigate climate change, based on the spatial co-occurrence of vulnerability to drought and fire and potential carbon sequestration. Source: Buotte et al. 2020
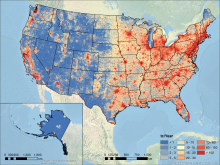
Vulcan v3.0 FFCO2 annual total emissions (tC/km2/year) for the United States in 2011 at a 1 km resolution. Source: Figure 3(a) in Gurney et al., 2020.
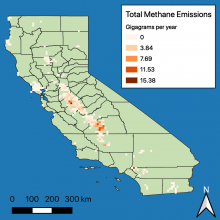
The sum of manure management and enteric fermentation methane emissions (in gigagrams per year) from dairy farms in California.
A new dataset from the North American Carbon Program (NACP) quantifies methane emissions from dairies across California.
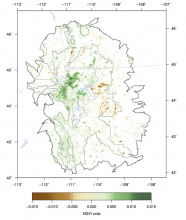
Trends in maximum annual NDVI for natural vegetation within the Greater Yellowstone Ecosystem (GYE) from 1989 to 2014 (Emmett et al. 2019).
Daymet and North American Carbon Program (NACP) data were used to study Normalized Difference Vegetation Index (NDVI) trends across the Greater Yellowstone Ecosystem.

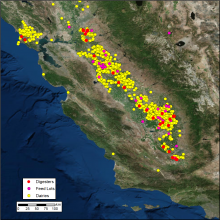
Vista-CA provides locations of methane (CH4) emitting facilities and infrastructure in the State of California. In this figure, the distribution of digesters, feed lots, and dairies across the San Francisco Bay Area and Central Valley are shown.
The Vista-CA dataset provides locations of potential methane (CH4) emitting facilities and infrastructure across the state of California.

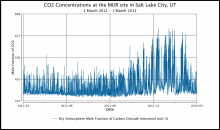
Carbon dioxide concentrations at the MUR site in Salt Lake City, Utah, show a pronounced seasonal pattern of higher CO2 in the winter months.
Hourly urban greenhouse gas measurements are available for cities in the CO2 Urban Synthesis and Analysis (CO2-USA) Data Synthesis Network.

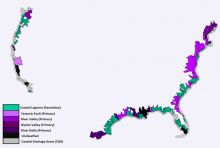
Estuaries classes used in the study: former river valley primary estuary, former glacier valley primary estuary, river delta primary estuary, tectonic structural primary estuary, coastal lagoon secondary estuary, and unclassified estuary.
Soil organic carbon (SOC) estimates and environmental data for US estuaries are available for the period 1972-2015.
