Body
Four digital elevation models (DEMs) at 1-m resolution and 2106 model performance metrics for the GCReW site, Maryland, USA are now available.

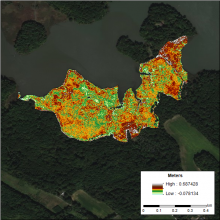
DEM of the Global Change Research Wetland (GCReW) site generated using the LEAN (LiDAR Elevation Correction with NDVI) method. LEAN uses ground measurements of elevation and NDVI in a multivariate linear regression model to estimate vertical bias.
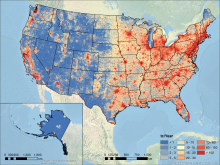
Vulcan v3.0 FFCO2 annual total emissions (tC/km2/year) for the United States in 2011 at a 1 km resolution. Source: Figure 3(a) in Gurney et al., 2020.
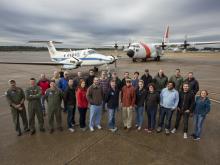
The ACT-America team on the tarmac with the NASA Langley Beechcraft B-200 King Air and NASA GSFC C-130-H Hercules aircraft in Shreveport, LA.
A new version of meteorological and aircraft navigational data is available from the Atmospheric Carbon and Transport-America project.
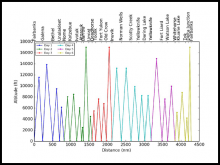
Arctic-CAP flights consisted of vertical profile maneuvers from near the surface to 6 km altitude around the ABoVE domain each month. Profiles were flown at each of the 25 locations listed across the top of this figure.
Atmospheric gas concentrations collected during the Arctic Carbon Aircraft Profile (Arctic-CAP) campaigns are now available.

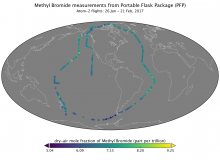
Dry-air mole fraction of methyl bromide measured in Programmable Flask Package samples taken during Atom-2 flights in January-February 2017.
Two new instrument datasets available from the Atmospheric Tomography Mission (ATom).

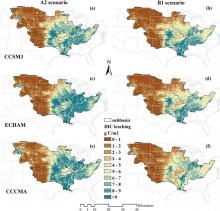
Spatial distribution of mean dissolved inorganic carbon (DIC) leaching (g c/m2/yr) in the 2090s estimated by S(ALL) simulation experiment (including future climate, elevated CO2, and land use changes). Climate change scenarios were derived from three climate models named CCSM3 (panels a and b), ECHAM (c and d), and CCCMA (e and f) under high (A2) and low (B1) emission scenarios, respectively.
New data from the Carbon Monitoring System (CMS) offers insights into how environmental factors affect the dynamics of leaching.

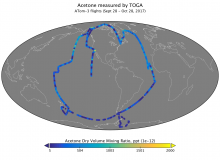
Measurements of atmospheric acetone concentration from samples collected by the Trace Organic Gas Analyzer (TOGA) during ATom-3 flights in 2017.
Concentrations of volatile organic compounds (VOCs), measured by the Trace Organic Gas Analyzer (TOGA), are available.

Estimates of the height of the planetary boundary layer (PBL) are available from the Atmospheric Carbon and Transport - America (ACT-America) airborne campaign.

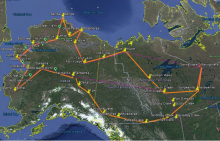
Arctic-CAP flight lines (orange) sampled Arctic and boreal regions of Alaska and Canada. Pins mark the locations of vertical profiles that were repeatedly acquired during the 2017 growing season.
Atmospheric carbon and methane concentrations were measured during the 2017 Arctic Carbon Aircraft Profile (Arctic-CAP) flights throughout Alaska and western Canada.

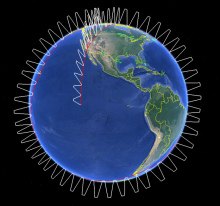
Generalized overview of ATom flights. During each of the four campaigns, ATom flights originated from California, flew south over the Pacific Ocean, then north to the western Arctic, southwest to New Zealand, east to Chile and the Atlantic Ocean, north to Greenland, and returned to California across North America. During flights, the aircraft continuously profiled the atmosphere from 0.2 to 12 km altitude.
The Atmospheric Tomography Mission (ATom) has released multi-instrument merged data from all four flight campaigns spanning from 2016 - 2018.
