Body
GEDI L4A Footprint Level Aboveground Biomass Density, Version 1 released.

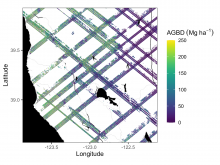
Example subset of aboveground biomass density (AGBD; Mg ha-1) predictions from the GEDI Level-4A footprint version 2.1 product over Northern California, USA, spanning April to July 2019. GEDI footprints are spaced 60m along track and 600m across-track.
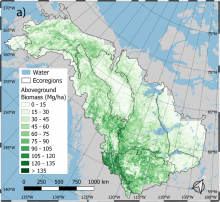
Spatial distribution of predicted aboveground biomass (AGB) density averaged over 1984-2014 for the ABoVE Core Study Domain. Ecoregions represent the EPA Level 2 Ecoregion boundaries. Source: Wang et al. (2021)
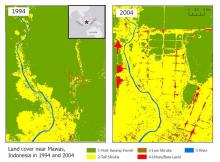
Land cover maps at 30 m resolution across Mawas, Central Kalimantan, Indonesia in 1994 (left) and 2004 (right).

The GEDI instrument onboard the ISS uses three lasers split into eight tracks that fire 242 times per second illuminating a 25-meter footprint of the Earth's surface.
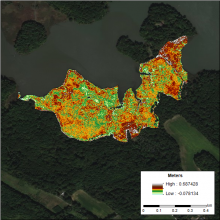
DEM of the Global Change Research Wetland (GCReW) site generated using the LEAN (LiDAR Elevation Correction with NDVI) method. LEAN uses ground measurements of elevation and NDVI in a multivariate linear regression model to estimate vertical bias.
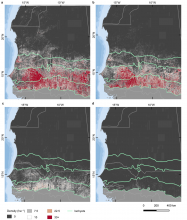
The tree density per hectare is shown for different crown size classes: (a) 3-15 m2, (b) 15-50 m2, (c) 50-200 m2, (d) >200 m2. Source: Brandt et al. (2020)
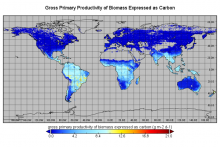
Global monthly gross primary productivity (GPP) of biomass for December 2016.
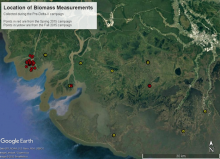
Location of wetland sites in the Mississippi River Delta where biomass measurements were collected in the Pre-Delta-X Spring and Fall 2015 Campaigns.
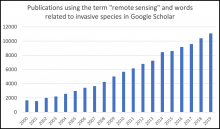
Searching for the term remote sensing and words related to invasive species (invasive, nonnative, exotic, or nonindigenous) in Google Scholar reveals an increasing number of publications each year using these terms.
A new Earthdata article describes how researchers are using remote sensing to map invasive species.
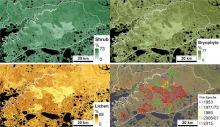
Vegetation point-intercept (VPI) any-hit cover metric data were combined with Landsat imagery to develop fractional maps of any-hit cover for four aggregated plant functional types (PFTs); shrubs bryophytes, lichen, and herbs for the upland tundra area of the Y-K Delta, Alaska. VPI data were collected from plots in areas burned in 1971, 1985, 2005, and 2015.
Ecological field data and maps of vegetation cover spanning gradients of fire history in upland tundra are available from the Arctic-Boreal Vulnerability Experiment (ABoVE).