Body
Vegetation change data spanning the West African Sudano-Sahel region is now available.

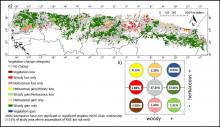
Concurrent woody and herbaceous vegetation changes between the 1982-1991 and 2004-2013 decades of the Sudano-Sahel region of Africa. (A) Map of vegetation change categories. (B) Chart showing the conceptual position and the relative abundance of each category in a 2-D space.
Vegetation change data spanning the West African Sudano-Sahel region is now available.
Annual estimates of fractional land use and cover patterns are available for the period 2015 to 2100.
GEDI data will help further refine our understanding of the carbon cycle and atmospheric concentrations of carbon dioxide (CO2).
Level 1 and 2 high-resolution, laser altimetry data from the Global Ecosystem Dynamics Investigation (GEDI) are now available from the LP DAAC.
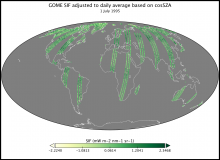
Solar-Induced Fluorescence derived along ERS-2 GOME orbital tracks on 1 July 1995.
Global estimates of solar-induced fluorescence (SIF) of chlorophyll from 1995 to 2003 are now available.

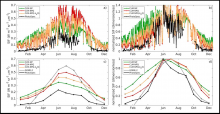
Simulated and observed seasonal patterns of canopy SIF (740 nm) for (a, c) absolute SIF and (b, d) normalized canopy SIF for CLM simulation year 2010. Both a satellite SIF product (GOME-2) and the PhotoSpec measurements are included for comparison.
Three related datasets from the Carbon Monitoring System (CMS) program describe year-round photosynthetic activity in a conifer forest.

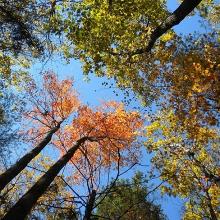
Upward-facing photo of the canopy at Harvard Forest (transect 2, plot 57) on 2012-10-18.
Ground-based data collected at the Harvard Forest site was used to validate Airborne Microwave Observatory of Subcanopy and Subsurface (AirMOSS) soil moisture estimates.

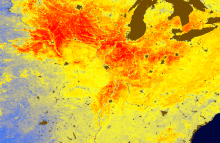
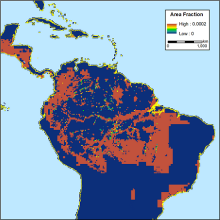
Predicted spatially contiguous solar-induced chlorophyll fluorescence (SIF) across the United States for August 1 - 16, 2015. Areas of high SIF are in red, and areas of low SIF are in blue. Agricultural areas, like the U.S. Midwestern corn belt, often have a high rate of photosynthetic production which results in high SIF.
High-resolution, global, estimates of SIF based on data from the OCO-2 satellite serve as a proxy for rates of terrestrial photosynthesis.
 across the United States")
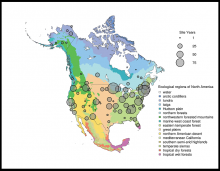
Spatial distribution of PhenoCam data across ecological regions of North America. Background map illustrates USA Environmental Protection Agency Level I Ecoregions. Data counts have been aggregated to a spatial resolution of 4i, and the size of each circle corresponds to the number of years of data.
A new version of the PhenoCam vegetation phenology data products is now available.

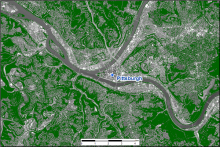
Estimated tree canopy cover (in green) near Pittsburgh, Pennsylvania, for the year 2008.
Statewide tree canopy cover at 1m resolution is now available for Maryland and Delaware.

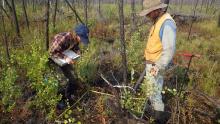
Investigators collected field data and inventoried plots for vegetation species and growth in 2018 at a post-burn site. (Image Credit: Laura Bourgeau-Chavez)
A new dataset completes four years of post-fire vegetation sampling at burned sites in Canada's Northwest Territories.
