Body
This mailing list is intended for people interested in the measurement, modeling, interpretation and broad applicability of solar-induced fluorescence, from the molecular to the planetary scale.


Optics of Photosynthesis Laboratory Logo
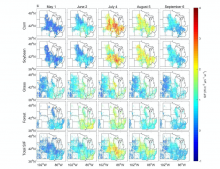
Examples of spatial patterns of reconstructed SIF at 4 km resolution. Only pixels with a fraction of the specific vegetation type larger than 0.1 are shown. For Total SIF, only pixels with a fraction of corn, soybean, grass/pasture, and forest larger than 0.8 are displayed.
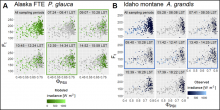
Relationship between the quantum yields of fluorescence (Ft) and photosystem II (Fv/Fm) sampled Picea glauca needles in Alaska (A) and Abies grandis needles in Idaho (B). Modeled (A) and observed (B) irradiance is indicated by the coloration of points; grey points in individual sampling period panels show observations from all periods for reference. Plots of sampling periods aligned with the timing of satellite overpasses are outlined in green (A) and blue (B) boxes, respectively.
In situ measurements of needle-level chlorophyll fluorescence and other irradiance products are now available.
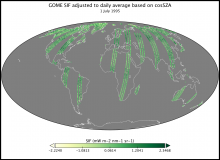
Solar-Induced Fluorescence derived along ERS-2 GOME orbital tracks on 1 July 1995.
Global estimates of solar-induced fluorescence (SIF) of chlorophyll from 1995 to 2003 are now available.

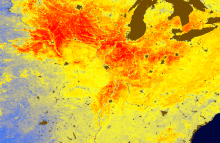
Predicted spatially contiguous solar-induced chlorophyll fluorescence (SIF) across the United States for August 1 - 16, 2015. Areas of high SIF are in red, and areas of low SIF are in blue. Agricultural areas, like the U.S. Midwestern corn belt, often have a high rate of photosynthetic production which results in high SIF.
High-resolution, global, estimates of SIF based on data from the OCO-2 satellite serve as a proxy for rates of terrestrial photosynthesis.
 across the United States")