Body
Predictions of the aboveground biomass density (AGBD; in Mg/ha) and estimates of the uncertainty within each sampled geolocated laser footprint.

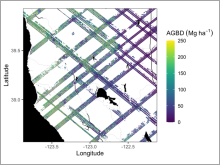
Example subset of aboveground biomass density (AGBD; Mg ha-1) predictions from the GEDI Level-4A footprint product over Northern California, U.S., spanning April to July 2019. GEDI footprints are spaced 60m along-track and 600m across-track.
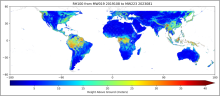
Level 3 estimated canopy height in meters derived from the Level 2 profile metric RH100 between the 19th and the 223rd mission week. Source: GEDI03_rh100_mean_2019108_2023081_002_05.tif
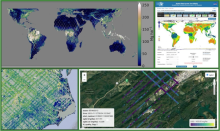
A set of example visualizations for GEDI mission data products.

NASA's GEDI observable is the lidar waveform, all products are derived from it.
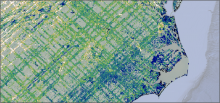
This screen capture from the GEDI L4B mean aboveground biomass density layer shows the crisscross pattern of GEDI's laser tracks on the Earth's terrestrial surface.
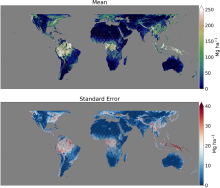
Gridded mean aboveground biomass density (top) and standard error of the mean (bottom).
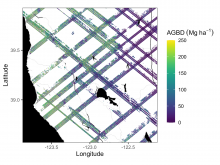
Example subset of aboveground biomass density (AGBD; Mg ha-1) predictions from the GEDI Level-4A footprint version 2.1 product over Northern California, USA, spanning April to July 2019. GEDI footprints are spaced 60m along track and 600m across-track.

Example subset of aboveground biomass density (AGBD; Mg ha-1) predictions from the GEDI Level-4A footprint product over Northern California, U.S., spanning April to July 2019. GEDI footprints are spaced 60m along-track and 600m across-track.

Logo of the Global Ecosystem Dynamics Investigation (GEDI) mission.
Example subset of aboveground biomass density (AGBD; Mg ha-1) predictions from the GEDI Level-4A footprint product over Northern California, U.S., spanning April to July 2019. GEDI footprints are spaced 60m along-track and 600m across-track.