Body
Annual land use/cover (LUC) maps at 30 m resolution across Mawas, Central Kalimantan, Indonesia.

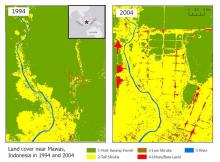
Land cover maps at 30 m resolution across Mawas, Central Kalimantan, Indonesia in 1994 (left) and 2004 (right).
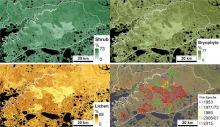
Vegetation point-intercept (VPI) any-hit cover metric data were combined with Landsat imagery to develop fractional maps of any-hit cover for four aggregated plant functional types (PFTs); shrubs bryophytes, lichen, and herbs for the upland tundra area of the Y-K Delta, Alaska. VPI data were collected from plots in areas burned in 1971, 1985, 2005, and 2015.
Ecological field data and maps of vegetation cover spanning gradients of fire history in upland tundra are available from the Arctic-Boreal Vulnerability Experiment (ABoVE).
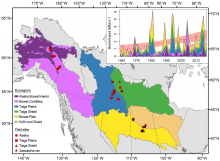
Field sites, ecoregions, and total area burned (millions of hectares; Mha) in each of the ecoregions in the study domain over time. Grey dotted line in the inset represents the simple linear regression, with red shading for the 95% confidence intervals, of burned area for all ecoregions combined. Analyses were completed using the field site groupings, located within the six ecoregions defined by the EPA Level II Ecoregions of North America.
Burned forest plot data is available from the Arctic-Boreal Vulnerability Experiment (ABoVE).
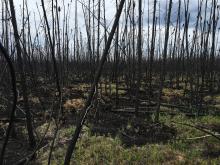
A typical burned plot in the Saskatchewan, Canada, boreal forest study area.
Fire history and field measurements were used to estimate above- and belowground carbon values.

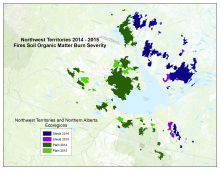
Study area included sites burned in 2014 and 2015 in the southeastern portion of the Northwest Territories and northern Alberta of Canada. The study area includes all 2014 and 2015 fires within a radius of approximately 300 km from Great Slave Lake.
Pre- and post-fire Landsat images were used to classify burn severity of soil organic matter across portions of arctic Canada.

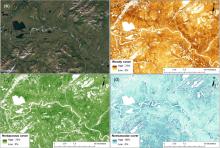
Examples of fractional cover distribution in a tundra region near Lake Narvakrak in the Noatak River National Preserve: (a) very high-resolution imagery from Google Earth; (b) fractional cover of woody component; (b) fractional cover of herbaceous component; (d) fractional cover of nonvascular component.
Maps of three major wildland fire fuel types are available from the Arctic-Boreal Vulnerability Experiment.

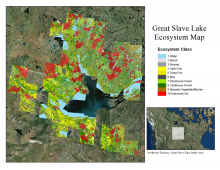
Ecosystem map for the Great Slave Lake area, Northwest Territories, Canada, for the period 1997-2011.
ABoVE researchers compiled a map of ecosystem states prior to the 2014 & 2015 fires in the Northwest Territories, Canada.

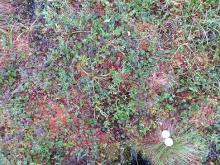
A plot photo (#0656) taken at the largest study area 'Toolik' at elevation 765.7 m. The small white object was included in many of the photos as a color reference. The photographer's boots are also often visible, in this photo they are to the lower left of the white object.
A new ABoVE dataset offers hundreds of ground-based vegetation photos which may serve as a reference for studies of climate and vegetation change in the area.

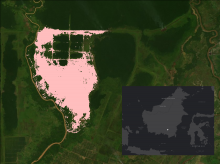
The area burned in 1997 and 1998 in the Mawas area, Central Kalimantan, Indonesia is shown in pink. The inset with white dot shows the location of Mawas study site on the Island of Borneo.
Maps of annual burned area from 1997 to 2015 show the extent of fires in the Mawas region of Central Kalimantan.

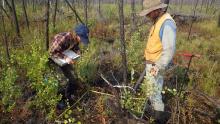
Investigators collected field data and inventoried plots for vegetation species and growth in 2018 at a post-burn site. (Image Credit: Laura Bourgeau-Chavez)
A new dataset completes four years of post-fire vegetation sampling at burned sites in Canada's Northwest Territories.
