Body
Level 1 atmospheric greenhouse gas concentrations are available for towers across the central and eastern USA.

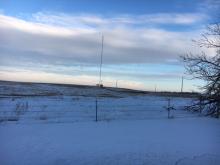
The communication tower at the Wessington, South Dakota site. This site was instrumented from January of 2017 to September of 2019.
Level 1 atmospheric greenhouse gas concentrations are available for towers across the central and eastern USA.
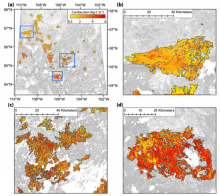
Spatial estimates of total carbon combustion at 30 m resolution across the 2015 fire perimeters in Saskatchewan (a) and sampled fires (b, c, d). The spatial extents of sampled fires are shown as blue rectangles in (a).
A new Arctic-Boreal Vulnerability Experiment (ABoVE) provides spatial estimates of carbon combustion and uncertainty on a 30 m grid.
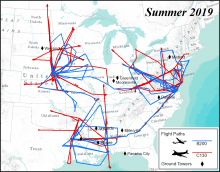
ACT-America 2019 summer airborne campaign showing the flight paths for the two aircrafts and location of ground towers. Flights were concentrated on three study domains: northeast, south-central, and midwest regions of the United States.
A new version of merged in situ atmospheric trace gases and flask data from the Atmospheric Carbon and Transport-America project is now available.
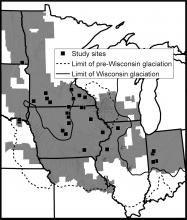
Study area in the Midwestern US with study site locations and extent of analysis. The study area was limited to the spatial extent of LiDAR topographic data (gray hillshade). Squares represent the 28 sites, a total of 210 km2, that were selected for having plowed, bare soil.
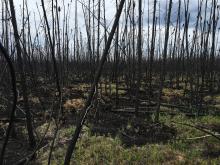
A typical burned plot in the Saskatchewan, Canada, boreal forest study area.
Fire history and field measurements were used to estimate above- and belowground carbon values.

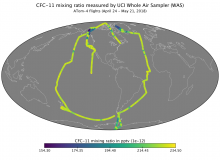
Mixing ratio of CFC-11 measured by Whole Air Sampler (WAS) during ATom-4 flights in April-May 2018.
The UC-Irvine Whole Air Sampler (WAS) instrument was used during the Atmospheric Tomography (ATom) mission.
, April-May 2018.")
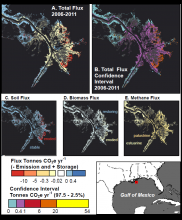
Estimated CO2e fluxes and confidence interval ranges for the Mississippi River outlet in Louisiana, United States. This area contains palustrine and estuarine wetlands, and includes stable wetlands, wetland gains and loss events from 2006 to 2011. A: Total flux from 2006 to 2011. B. Uncertainty, as represented by confidence interval range (0.975 - 0.025 quantile distributions of the results of the Monte Carlo Analysis). C-E. The relative contributions of soil, biomass, and methane to the total flux (A).
A new dataset provides maps of surface elevation, land cover, biomass, and estimated coastal wetland carbon fluxes.

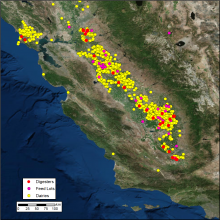
Vista-CA provides locations of methane (CH4) emitting facilities and infrastructure in the State of California. In this figure, the distribution of digesters, feed lots, and dairies across the San Francisco Bay Area and Central Valley are shown.
The Vista-CA dataset provides locations of potential methane (CH4) emitting facilities and infrastructure across the state of California.

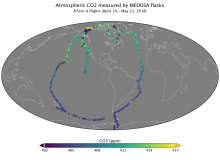
Measurements of atmospheric carbon dioxide concentration from flasks collected by the Medusa system during ATom-4 flights in 2018.
NASA's Atmospheric Tomography (ATom) campaign collected whole air samples and measurements of formaldehyde during round-the-world flights.

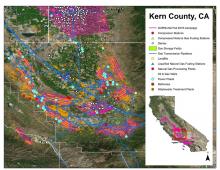
Example of AVIRIS-NG flight lines over the southern San Joaquin Valley, Kern County, CA, in Fall 2016 and the Vista-CA potential methane emitting facilities and infrastructure for the three primary sectors (energy, agriculture, and waste).
Maps of methane plumes were derived from Next-Generation Airborne Visible Infrared Imaging Spectrometer (AVIRIS-NG) flights over California.
