Body
Measurements from the HALO instrument, DIAL, and HSRL, operating at 532 nm and 1064 nm wavelengths onboard a C-130 aircraft during the June and July 2019 ACT-America campaign.

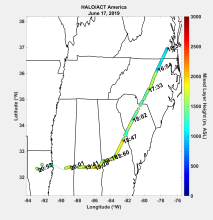
Map of mixing layer height across the sampling area. Source: 20190617_MixedLayerHeight_map.png
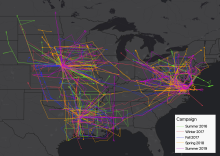
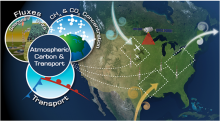
Flight paths for five airborne campaigns of ACT-America that provided receptor locations and CO2 measurements for these FLEXPART simulations. Flights were concentrated on three study areas: the northeast, south-central, and mid-west regions of the United States.
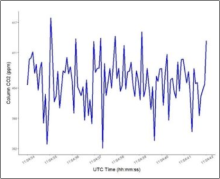
A sample of column CO2 concentrations retrieved on May 27, 2016, over eastern North Carolina.
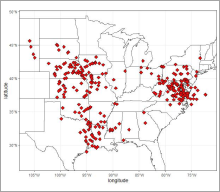
Locations of ACT-America flights collecting MFLL carbon dioxide (CO2) measurements over eastern and central U.S. in 2016-2018.
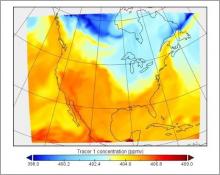
Simulated tracer 1 concentrations (ppmv) in vertical level 5 on 2016-06-29 at 12:00 pm. Output from WRF-Chem (v. 3.6.1) model.
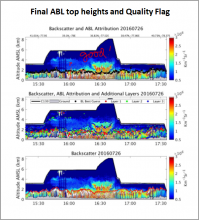
Top: Annotated time-height cross-section of aerosol backscatter profiles measured using CPL onboard C-130 aircraft on 2016-07-26. Wavelet-derived ABL top (black solid-circles) height overlaid. Middle: Secondary aerosol layers overlaid on the top panel. Bottom: Final attributed ABL top heights.
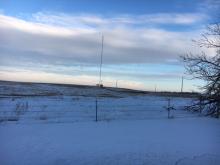
The communication tower at the Wessington, South Dakota site. This site was instrumented from January of 2017 to September of 2019.
Level 1 atmospheric greenhouse gas concentrations are available for towers across the central and eastern USA.
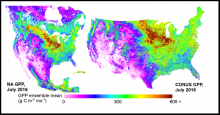
Mean gross primary productivity (GPP) for the conterminous US and North America in grams of carbon per unit area per month.
Modeled estimates of biogenic CO2 exchanges between land and atmosphere across portions of North America are available.
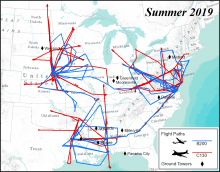
ACT-America 2019 summer airborne campaign showing the flight paths for the two aircrafts and location of ground towers. Flights were concentrated on three study domains: northeast, south-central, and midwest regions of the United States.
A new version of merged in situ atmospheric trace gases and flask data from the Atmospheric Carbon and Transport-America project is now available.