Body
Five Pre-Delta-X Airborne datasets recently published provide sea water level profile and change derived from UAVSAR, AirSWOT, and lidar.

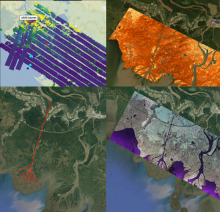
Collage of dataset airborne imagery from AirSWOT, UAVSAR and the ASO lidar instrument provide examination of water level elevation estimates and changes.
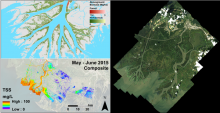
Pre-DeltaX image highlights: AVIRIS-NG/UAVSAR Biomass (upper left), AVIRIS-NG Total Suspended Solids (lower left), and AVIRIS-NG Surface Reflectance (right).
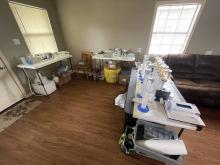
The Channel Team's water filtering lab inside a local cabin. The team will process 800 liters of water to extract as little as ~100mg of material found in a liter of Mississippi water.
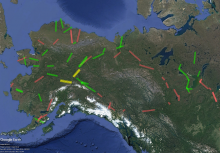
Sites in Version 2 of the Permafrost Dynamics Observatory Project product. Green = data delivered in Version 2. Red = not delivered in Version 2 but will be delivered in future version. Yellow = not processed due to only L-band data being available.

Example of Color-infrared imagery shown alongside the corresponding semi-automated open water classification at Old Crow Flats, Alaska.
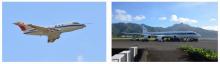
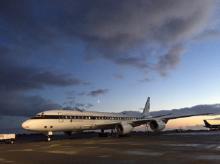
Left: The DLR Falcon used for the SALTRACE 2013 and the A-LIFE 2017 campaigns. Right: The NASA DC-8 aircraft used during the ATom missions sitting at the Pago Pago International Airport, American Samoa.
A new dataset from the Atmospheric Tomography Mission (ATom) compares airflow and aerosol particles.
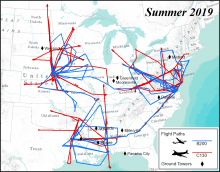
ACT-America 2019 summer airborne campaign showing the flight paths for the two aircrafts and location of ground towers. Flights were concentrated on three study domains: northeast, south-central, and midwest regions of the United States.
A new version of merged in situ atmospheric trace gases and flask data from the Atmospheric Carbon and Transport-America project is now available.
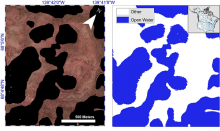
Example of color-infrared imagery shown alongside the corresponding semi-automated open water classification at Old Crow Flats, Alaska.
Over 3,000 km2 of open surface water were mapped from AirSWOT flight lines made in Summer 2017 for the Arctic-Boreal Vulnerability Experiment (ABoVE).

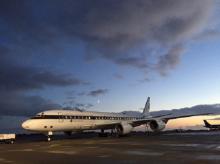
The NASA DC-8 aircraft was used for the ATom missions.
Aerosol data collected during Atmospheric Tomography Mission (ATom) will inform on new particle formation occurrence in the tropics.
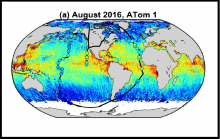
Circles mark the locations of the 139 selected profiles sampling the remote troposphere. Circle color indicates HCHO column densities integrated over each ATom profile. Data are overlain on global gridded OMI HCHO column densities averaged over the mission. From Wolfe et al. (2019) (see dataset references).
New data from NASA's Atmospheric Tomography Mission (ATom) provide hydroxyl and formaldehyde column density in the remote troposphere.
