
CARVE: L2 Atmospheric CO2, CO, and CH4 Concentrations, CARVE Tower, Alaska, 2011-2015
This data set provides atmospheric methane (CH4), carbon dioxide (CO2), and carbon monoxide (CO) dry air mole fractions and water vapor mole fractions (H2O) from continuous in situ measurements at the CARVE flux tower in Fox, Alaska between October 2011 and May 2015 for the Carbon in Arctic Reservoirs Vulnerability Experiment (CARVE). Air was drawn from three different heights above the base of the tower (31.7 m, 17.1 m, and 4.9 m) and analyzed using a Picarro cavity ring-down spectrometer (CRDS). Measurements of ambient and sonic temperature, vertical and horizontal velocity, and atmospheric pressure are also included in the data set.
Data Acknowledgements
Data authors: Miller, J.B., C. Sweeney, A. Karion, and C.E. Miller.
Data Set DOI: http://dx.doi.org/10.3334/ORNLDAAC/1419
Data center: ORNL DAAC
Sponsor: NASA EOSDIS
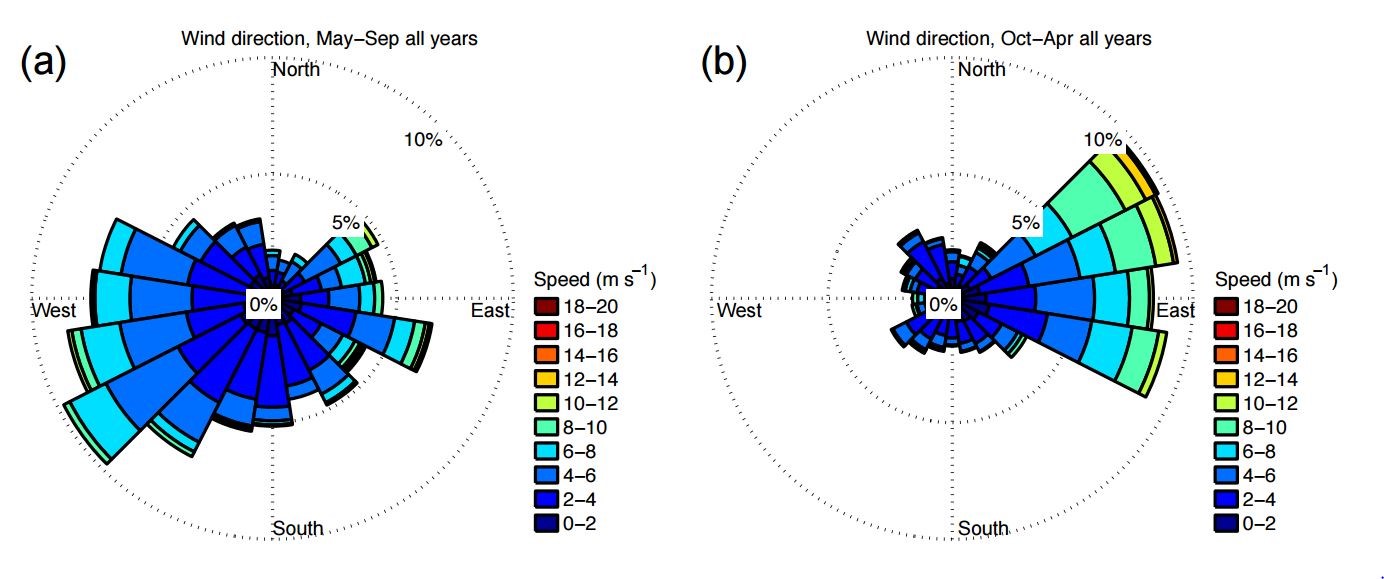
 May-September and (b) October-April for all 3 years during mid-afternoon hours at 32 m above ground level on the CARVE tower (from Karion et al., 2016).")