
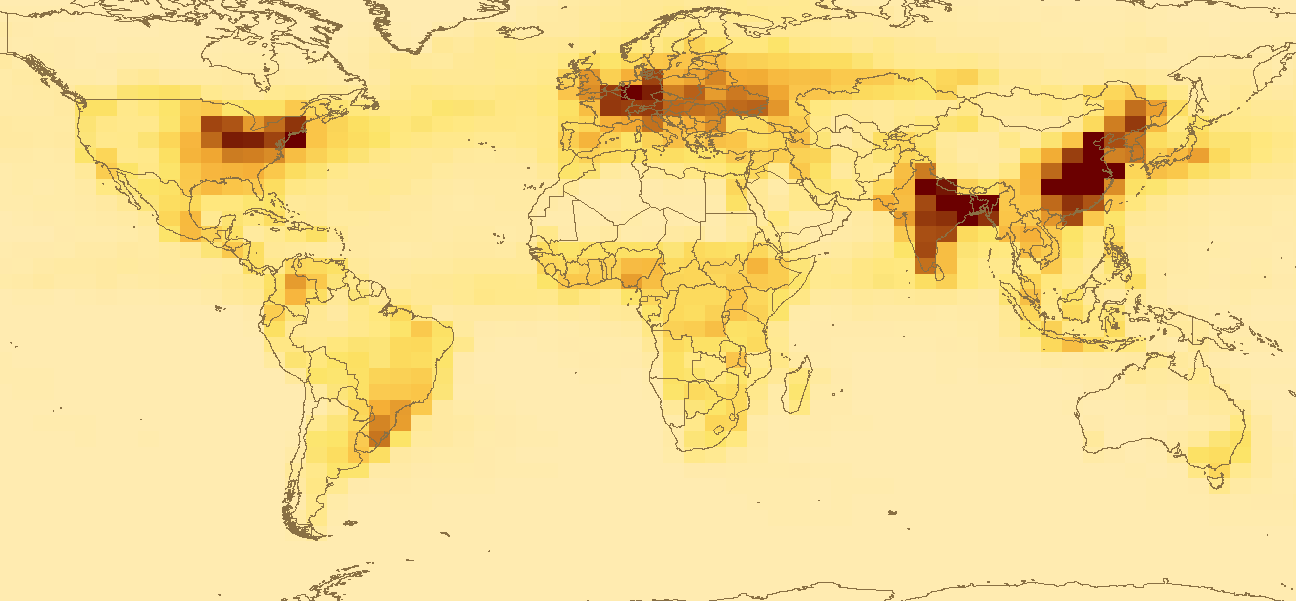
Global Maps of Atmospheric Nitrogen Deposition, 1860, 1993, and 2050
The dataset “Global Maps of Atmospheric Nitrogen Deposition”, first released in 2006, has accumulated over 5,330 downloads and over 75 citations in the scientific literature, making it one of the most popular datasets hosted at the ORNL DAAC.
The dataset provides global estimates of atmospheric nitrogen deposition in three forms for the years 1860 and 1993, and projected levels for the year 2050. In the scientific paper that accompanied this data, the authors addressed the questions (1) How has the global nitrogen budget changed from the late 19th century to the late 20th century? and (2) What is the global nitrogen budget projected to be in the mid-21st century? The answers to these questions can inform on how nitrogen influences biogeochemical processes across ecosystems, including net primary productivity, eutrophication, and air pollution.
The dataset “Global Maps of Atmospheric Nitrogen Deposition” continues to inform important questions in ecosystem science. For example, Belay et al. (2018) used the nitrogen deposition estimates to assess nitrogen fluxes in Ethiopian forests. In another recent paper, Yu et al. (2018) used the data to model long-term terrestrial carbon dynamics in the Midwestern United States.
See more papers that cited this dataset.
Data Citation: Dentener, F.J. 2006. Global Maps of Atmospheric Nitrogen Deposition, 1860, 1993, and 2050. ORNL DAAC, Oak Ridge, Tennessee, USA. https://doi.org/10.3334/ORNLDAAC/830
Data Center: ORNL DAAC
Sponsor: EOSDIS

