
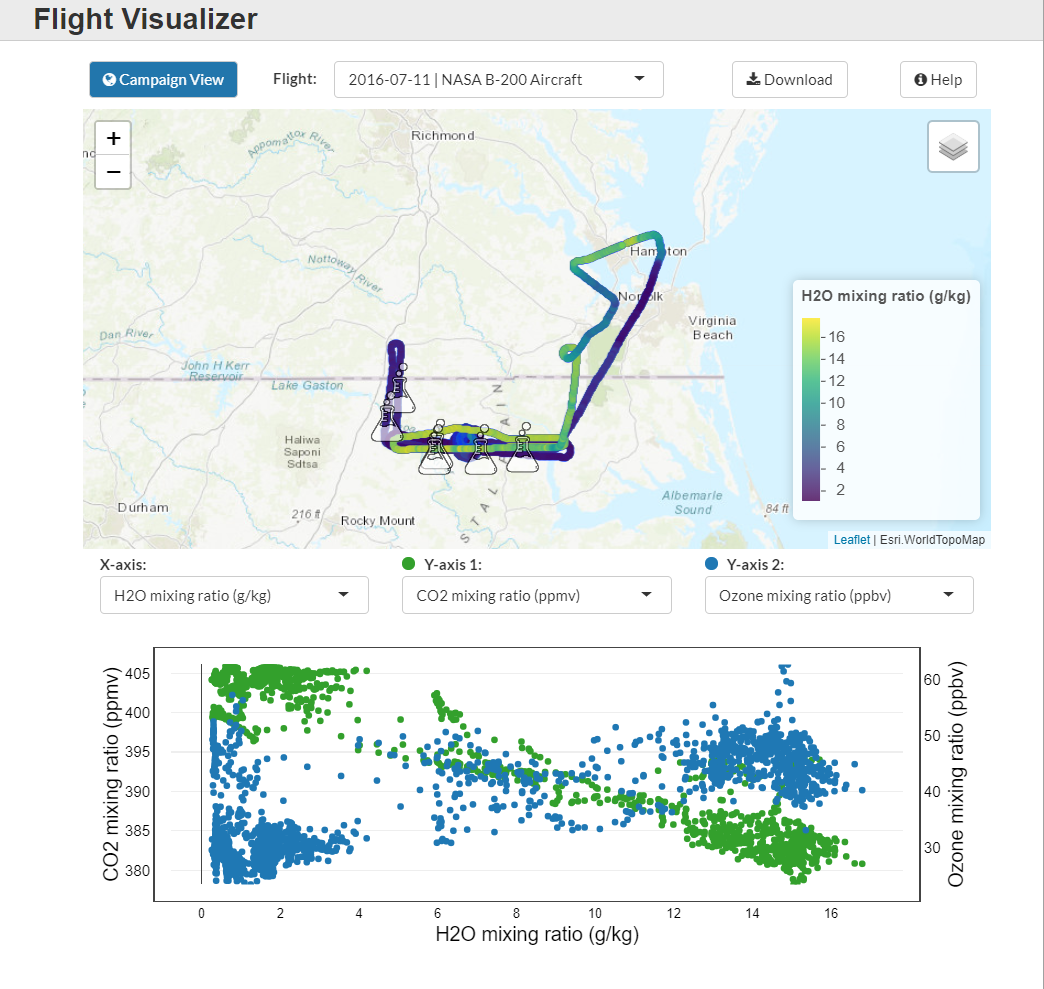
The Airborne Data Visualizer (ADV) is a tool for users to explore measurements collected during NASA airborne campaigns. The ADV is an interactive web application, based in R Shiny, with separate views for exploring flight details or scatterplots to view specific variables. Users can compare the geographic scope of measurements from different flights and then download the associated data files.
Data from the ACT-America (Atmospheric Carbon and Transport - America) airborne campaign is currently available through the ADV. The ACT-America data are continuous in-situ measurements of atmospheric carbon dioxide, methane, ozone, and other gases measured over the Eastern United States. ACT-America's objective is to enable more accurate and precise estimates of the sources and sinks of greenhouse gases that will inform climate management and predict future climates.
Data from other missions, including CARVE, and ATom, will be added to the ADV soon.
Access the Airborne Data Visualizer here: https://actamerica.ornl.gov/visualize.html
Recommended Citation: ORNL DAAC. 2018. Airborne Data Visualizer. ORNL DAAC, Oak Ridge, Tennessee, USA. https://doi.org/10.3334/ORNLDAAC/1585

