
Daymet: Station-Level Inputs and Model Predicted Values for North America, Version 3
A new data set reports the station-level daily weather observation data and the corresponding Daymet model predicted data for three Daymet model parameters: minimum temperature (tmin), maximum temperature (tmax), and daily total precipitation (prcp).
Each data file contains the daily observations and Daymet model predicted values for one variable and one year (1980 - the current full calendar year) for stations across North America. Also included are corresponding station metadata files for each variable and year, including the station name, station identification, latitude, and longitude.
These data are provided to facilitate station-level cross validation analyses that can offer insights into the regional accuracy of the Daymet model for the three station-level input parameters. Regression statistics and mean absolute error can be derived using the provided companion file R code to assess temporal and spatial patterns of uncertainty.
Data Acknowledgements
Data authors: Thornton, M.M., P.E. Thornton, Y. Wei, R.S. Vose, and A.G. Boyer.
Data Set DOI: http://dx.doi.org/10.3334/ORNLDAAC/1391
Data center: ORNL DAAC
Sponsor: NASA EOSDIS
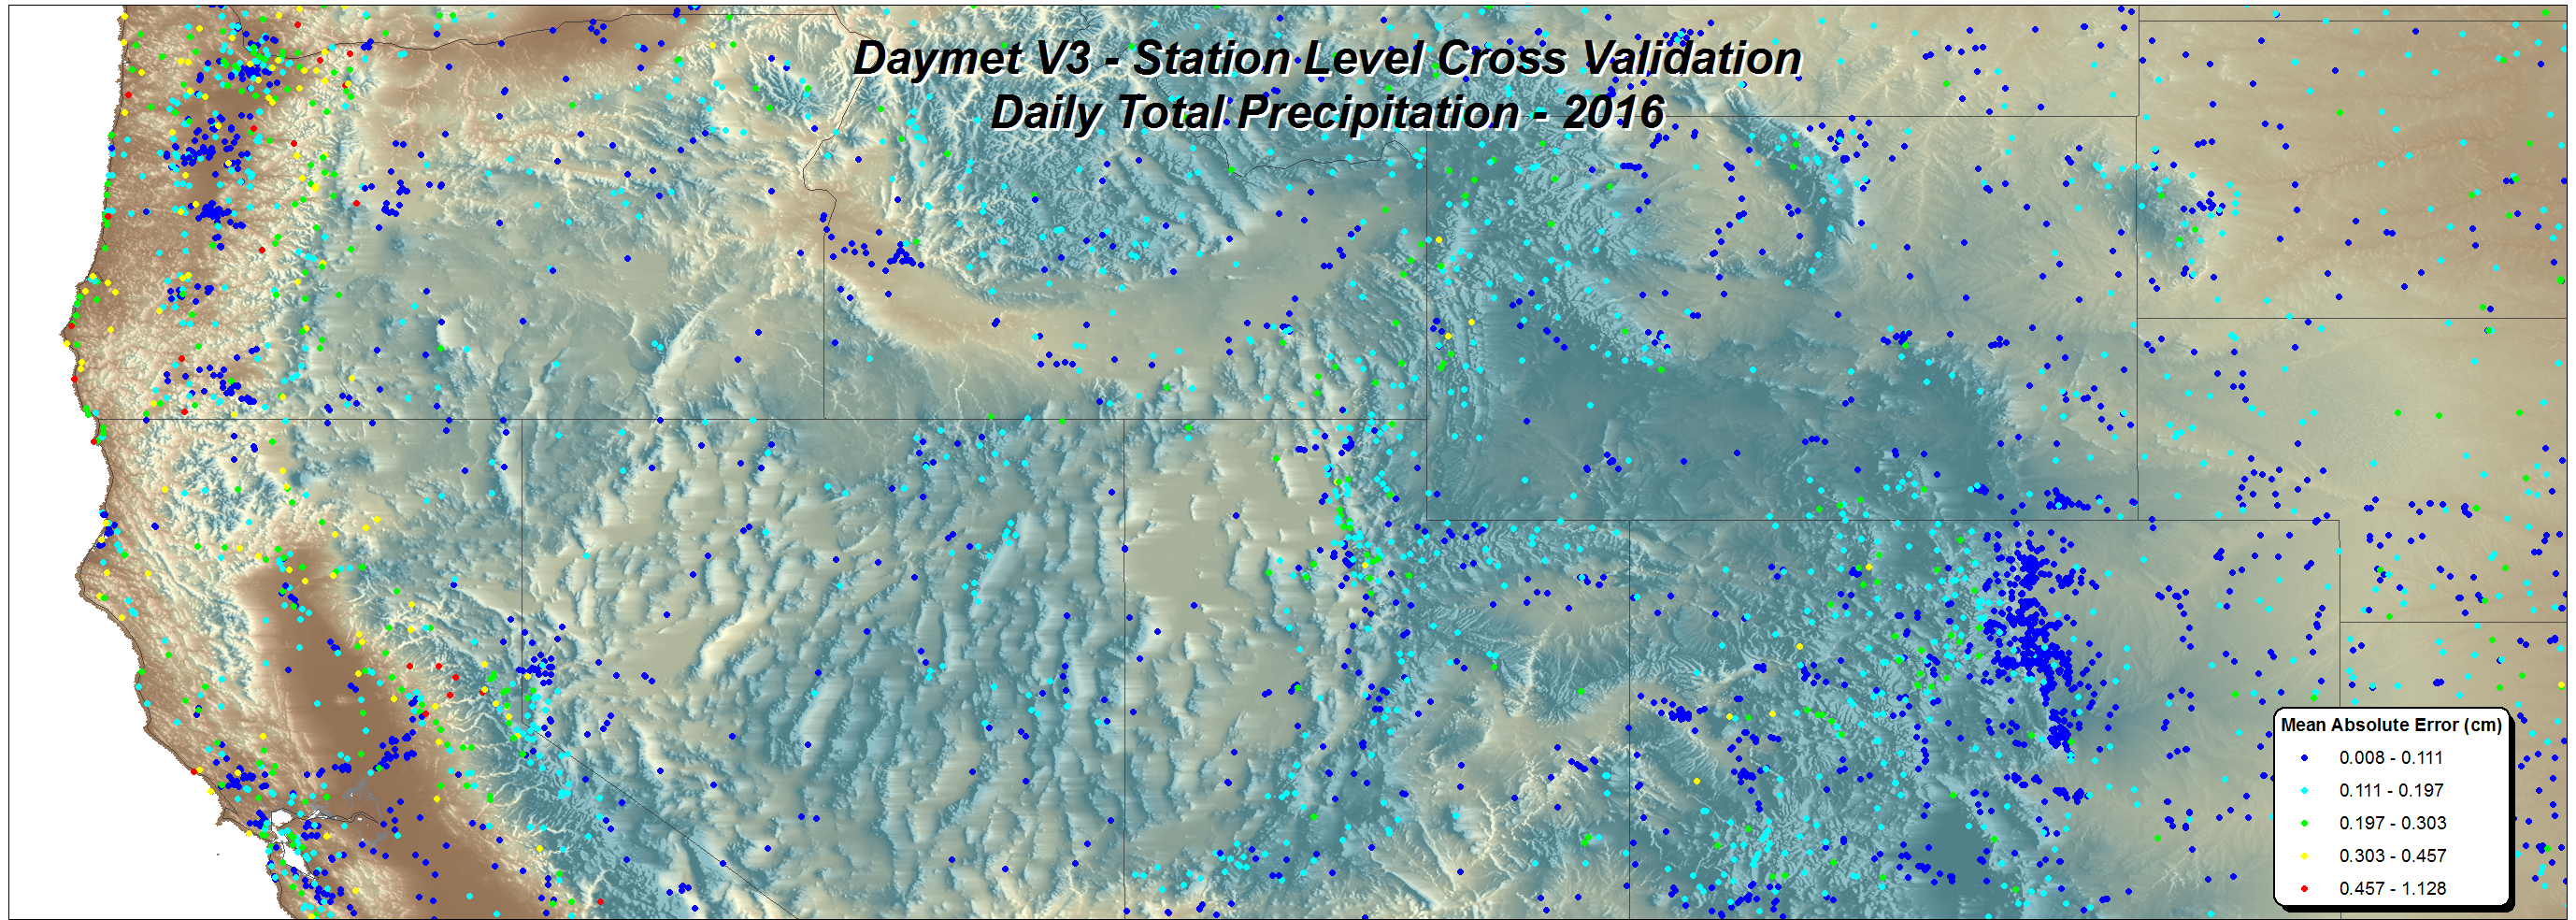
 of modeled precipitation from Daymet V3 for the year 2016 in the Western USA.")
 of modeled precipitation from Daymet V3 for the year 2016 in the Western USA.")