
Daymet: Annual 2-degree Tile Summary Cross-Validation Statistics for North America
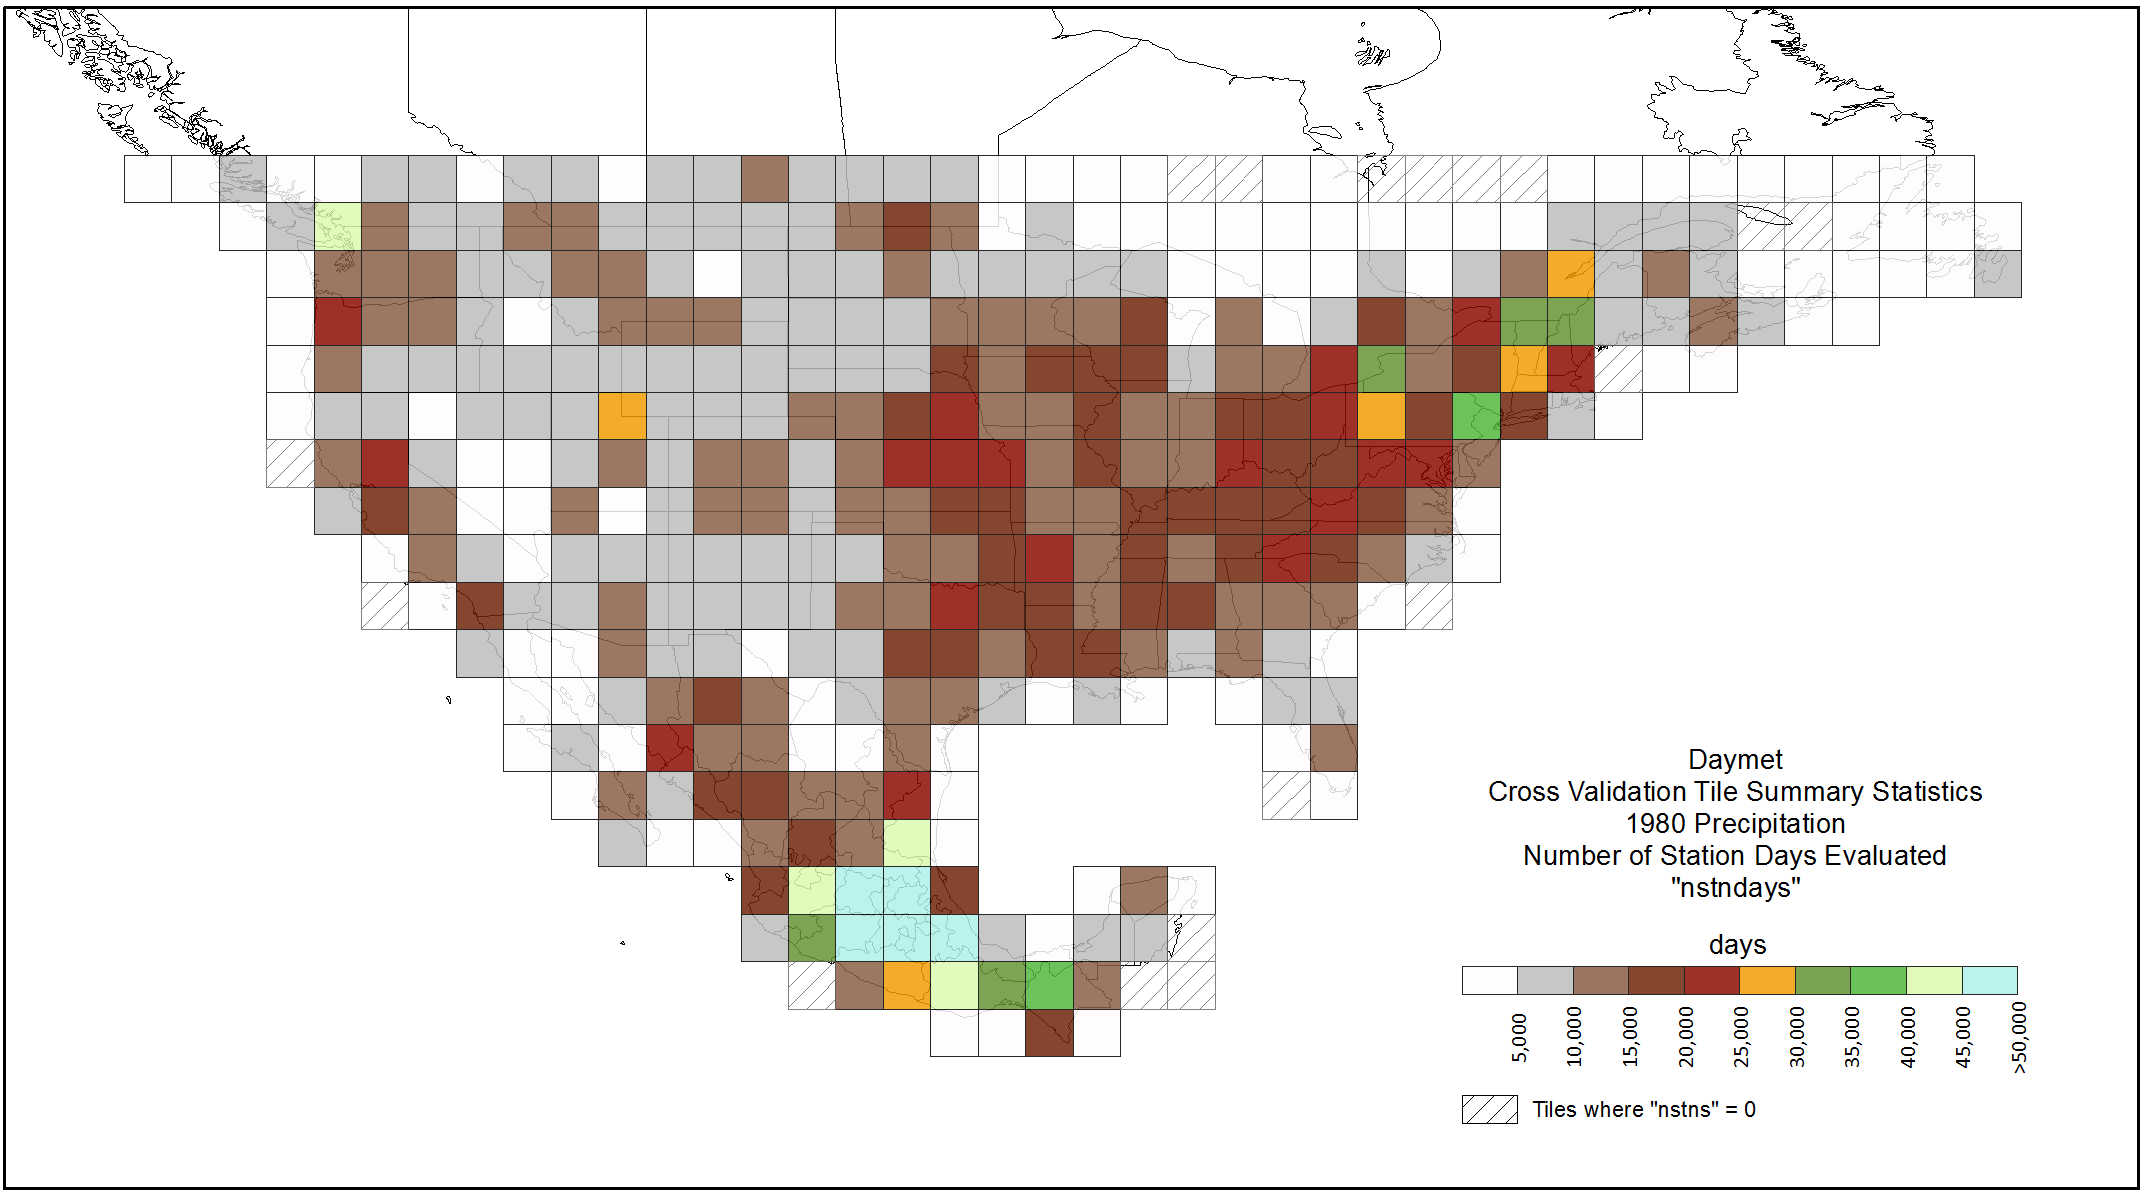
This data set provides annual summary cross-validation statistics for minimum temperature (tmin), maximum temperature (tmax), and daily total precipitation (prcp) of "Daymet: Daily Surface Weather Data on a 1-km Grid for North America, Version 2". These statistics represent the uncertainty in the Daymet temperature and precipitation estimates. Cross-validation statistics were generated by the Daymet model algorithm from the station-based daily observations and predictions and are summarized for each of the 2-degree by 2-degree tiles for which Daymet is derived. Data are available for the time period 1980 through 2015, the most recently processed calendar year of Daymet Version 2.
Data Acknowledgements
Data authors: Thornton, P.E., and M.M. Thornton
Data Set DOI: http://dx.doi.org/10.3334/ORNLDAAC/1303
Data center: ORNL DAAC
Sponsor: NASA EOSDIS
