
ABoVE: Active Layer Thickness from Remote Sensing Permafrost Model, Alaska, 2001-2015
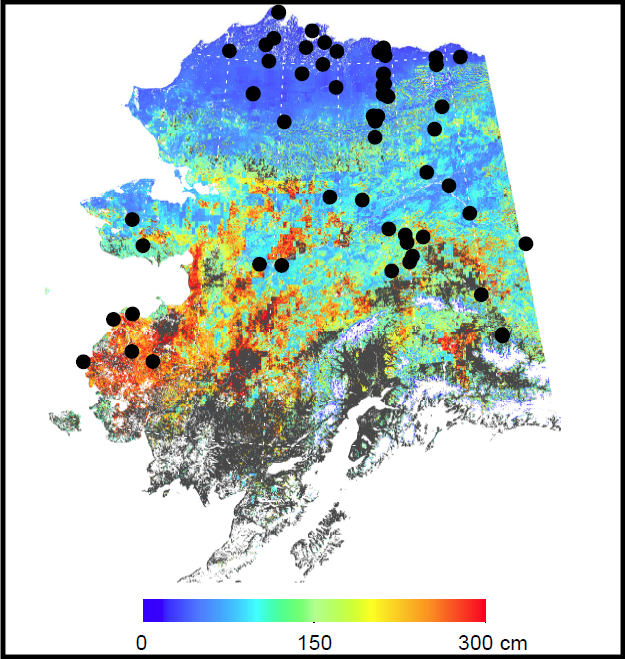
This dataset from the Arctic-Boreal Vulnerability Experiment (ABoVE) provides annual estimates of active layer thickness (ALT) at a 1 km resolution across Alaska from 2001-2015. Active Layer Thickness is defined as the maximum soil thawing depth throughout the year. The mean and mean uncertainty ALT are also provided. The ALT was estimated using a soil process model incorporating satellite data from the Moderate Resolution Imaging Spectroradiometer (MODIS) land surface temperature (LST) and snow cover extent (SCE) products and the Soil Moisture Active and Passive (SMAP) satellite soil moisture records. The study area covers the majority land area of Alaska except for areas of perennial ice/snow cover or open water.
ABoVE is a NASA Terrestrial Ecology Program field campaign being conducted in Alaska and western Canada, for 8 to 10 years, starting in 2015. Research for ABoVE links field-based, process-level studies with geospatial data products derived from airborne and satellite sensors, providing a foundation for improving the analysis, and modeling capabilities needed to understand and predict ecosystem responses to, and societal implications of, climate change in the Arctic and Boreal regions. See all ORNL DAAC data from ABoVE.
Data Citation: Yi, Y., and J.S. Kimball. 2020. ABoVE: Active Layer Thickness from Remote Sensing Permafrost Model, Alaska, 2001-2015. ORNL DAAC, Oak Ridge, Tennessee, USA. https://doi.org/10.3334/ORNLDAAC/1760