Body
Orthophotographs of lakes near of Fairbanks, AK, identify open holes in lake ice that indicate the location of releases of CH4 from thawing permafrost.

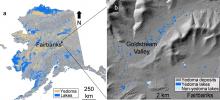
Location of the study area northwest of Fairbanks, AK, USA. The map shows (a) yedoma permafrost distribution and (b) yedoma lakes and terrain of the Goldstream Valley. Data sources include Strauss et al. (2016), Alaska LiDAR Dataset (USGS, 2018), Elevation Datasets of Alaska (DGGS Staff, 2013), and Walter Anthony et al. (2020).
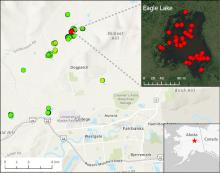
Location of 15 lakes surveyed for methane ebullition hotspots (green points) north of Fairbanks, AK, on October 8, 2014. Inset shows detail of Eagle Lake with locations of 43 hotspots (red points) detected by openings in lake ice.
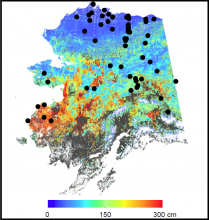
Model-simulated 1 km mean active layer thickness (ALT) map from 2001 to 2015. Black dots are locations of circumpolar active layer monitoring (CALM) sites used for comparison of observed ALT to modeled ALT. CALM data are not provided. The areas with ALT greater than 300 cm depth are shown in dark gray.
MODIS and SMAP satellite data were used to derive estimates of active layer thickness and uncertainty.
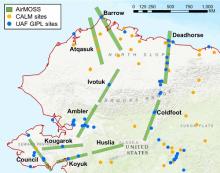
AirMOSS radar swaths flown in 2014 and 2015 in Alaska. In situ soil moisture and temperature profile measurements were obtained at the CALM (Circumpolar Active Layer Monitoring) and the UAF GIPL (Geophysical Institute Permafrost Laboratory, University of Alaska Fairbanks) sites and used to validate AirMOSS data products.
Airborne Microwave Observatory of Subcanopy and Subsurface (AirMOSS) radar data from Alaska are used to derive estimates of active layer thickness. Data from flights in 2014 and 2015 are now available.

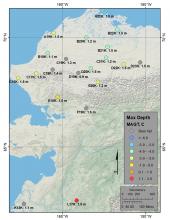
USArray measurement sites in Alaska. Sites are labeled with site ID and maximum measurement depth and color-coded by mean annual ground temperature (MAGT in degrees C) of the deepest sensor measurements. Data are omitted for sites disrupted by bears.
Soil temperature data were collected at Alaskan USArray seismic monitoring sites from 2016-2018.
