
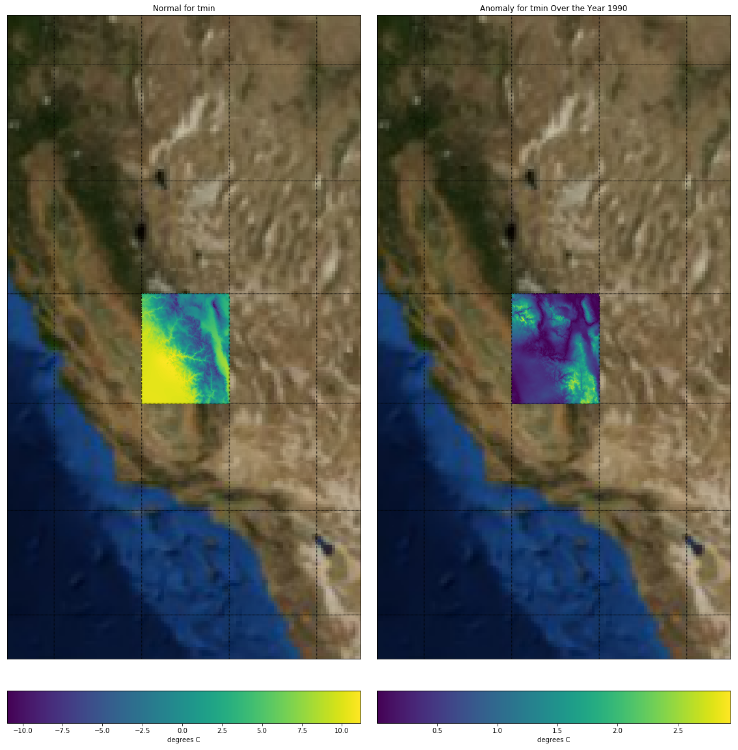
ORNL DAAC has released two new Jupyter Notebook tutorials that show how to access, subset, and plot Daymet climate data using our OPeNDAP web service. The tutorials explain the steps to subset the data to a specified spatial extent and date range, download data to your local machine, understand the dimensions and characteristics of the Daymet dataset, and plot data from within a Python environment. The tutorials further demonstrate how to calculate a long-term climate normal and anomalies for Daymet parameters such as daily minimum air temperature. A 30-year climate normal is calculated by averaging the weather estimate over the years 1981 – 2011, and anomalies are calculated by finding the difference between the normal and the average over a shorter time scale such as a few months. The tutorials also show how to plot the normal and anomalies on a basemap.
Jupyter notebook tutorials are available from the ORNL DAAC GitHub page at https://github.com/ornldaac.
Data Citation:
Thornton, P.E., M.M. Thornton, B.W. Mayer, Y. Wei, R. Devarakonda, R.S. Vose, and R.B. Cook. 2017. Daymet: Daily Surface Weather Data on a 1-km Grid for North America, Version 3. ORNL DAAC, Oak Ridge, Tennessee, USA. https://doi.org/10.3334/ORNLDAAC/1328
Data center: ORNL DAAC
Sponsor: NASA EOSDIS
