Body
New Jupyter notebook tutorials show how to access and visualize Daymet climate data from within Python and how to calculate climate normals and anomalies.

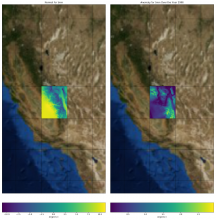
Climate anomaly (right panel) in minimum daily temperature for year 1990 compared to the long-term normal (left panel). The climate normal and anomaly were calculated for a single 2-degree tile from the Daymet dataset.
New Jupyter notebook tutorials show how to access and visualize Daymet climate data from within Python and how to calculate climate normals and anomalies.
