
Airborne in-situ data can be used to calibrate and validate other atmospheric measurements and to better understand carbon fluxes and their associated uncertainties on a continental and global scale.
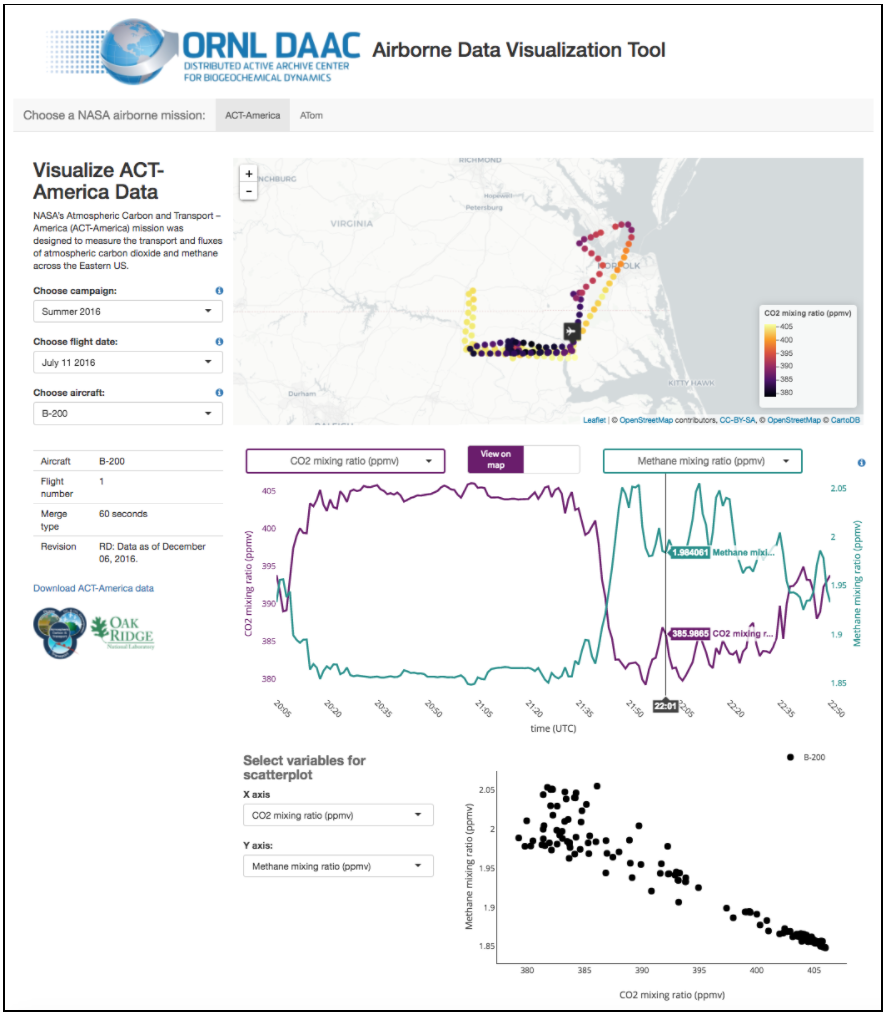
To assist in these efforts, a new tool created at the ORNL DAAC allows users to explore in-situ atmospheric gas measurements from multiple airborne missions. The Airborne Data Visualizer is a web application, built on R Shiny, with menus for selecting individual flight dates and variables to view on a map or on a series of plots. Users can compare the geographic scope of measurements from multiple missions and determine which dataset meets their needs. Users can then follow the links on the page to download individual data files from the data pool or they can view the dataset landing page to download larger amounts of data.
Check out the new Airborne Data Visualizer!
The application will be updated frequently to include data from additional missions, and new data from ongoing missions such as ACT-America and ATom. Each mission has a combination of the following measurements available: CO2, CO, and CH4 data collected with an infrared cavity ring-down spectrometer system (CRDS; Picarro Inc.); ozone data collected with a dual beam differential UV absorption ozone monitor (Model 205; 2B Technologies); and trace gases collected using Programmable Flask Package (PFP) at various intervals. Flight path, navigational, and meteorological data is also available.
More information about each airborne mission is available below:
Data Citation:
ORNL DAAC. 2018. Airborne Data Visualizer. ORNL DAAC, Oak Ridge, Tennessee, USA. https://doi.org/10.3334/ORNLDAAC/1585
Data center: ORNL DAAC
Sponsor: NASA EOSDIS
