Body
Annual estimates of six carbon pools across the conterminous United States for 2005, 2010, 2015, 2016, and 2017.

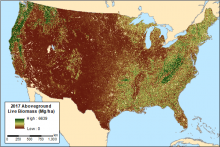
Figure 1. Aboveground live biomass across CONUS for the year 2017 derived from the MaxEnt model.
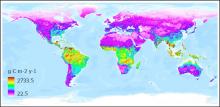
Mean global soil respiration derived from Version 5 of the Soil Respiration Database (SRDB-V5).
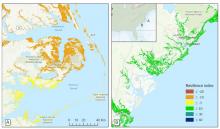
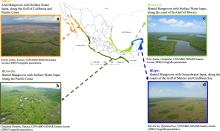
Contrasting levels of resilience of tidal marshes to sea-level rise in eastern North Carolina (A) and coastal South Carolina (B).
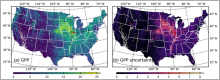
Spatial distribution of (a) GPP (gC m2/d) and (b) GPP uncertainty (gC m2/d) across CONUS at 250-m resolution for 10 July 2020
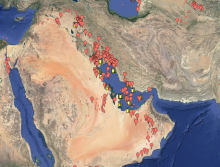
Representation of gas flares recorded over the Persian Gulf in 2019 by Earth Observation Group's Global Gas Flare Survey.
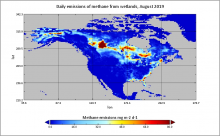
Estimated daily emissions of methane from wetlands in North American for August 2019.
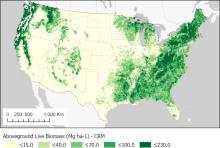
Estimates of aboveground biomass of live trees (diameter >2.54 cm) on forested lands in the conterminous U.S. Estimates were developed from the FIA component ratio method.
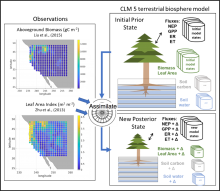
Overview of the assimilation system (CLM5-DART) that combines observations with model ensemble simulations from CLM5.0. Satellite-derived observations of aboveground biomass and leaf area index were used to adjust the simulated model state of CLM5.0. Source: Razcka et al. (2021)
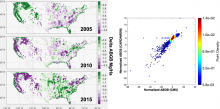
ABGB outputs over CONUS derived from CARDAMOM vs. the CMS project-funded ABGB estimated from inventory and satellite data (Yu et al., 2021). The left panel shows the colormaps of differences between ABGB from CARDAMOM and ABGB from CMS for the years 2005, 2010, and 2015. The right panel is the scatter plot showing the pixel-level ABGB deviations from the 1:1 line for CARDAMOM- and CMS-derived outputs.
Categories of persistent mangrove forests on the coasts of Mexico.