Body
This dataset provides 30 m gridded estimates of aboveground biomass density (AGBD), forest canopy height, and tree canopy coverage for the New England Region of the USA for 2015.

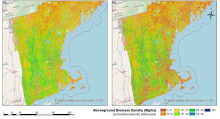
30 m resolution maps of aboveground biomass density (AGBD) over the New England region in 2015. a) The mean of the posterior distribution sampled from a Markov chain Monte Carlo (MCMC) model. b) The AGBD estimate over an entire pixel adjusted by canopy cover (i.e., AGBD multiplied by canopy cover percentage). Source: Tang et al., 2021
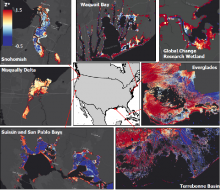
Relative tidal elevation (Z*) representing diverse locations spanning the Conterminous United States.
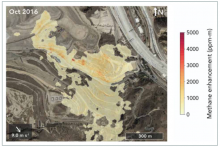
The AVIRIS-NG instrument detected large methane plumes coming from Sunshine Canyon Landfill during its October 2016 overpass. The plumes are shown in a yellow to red gradient, with red representing higher concentrations of methane. Image credit: Cusworth et al. 2020.
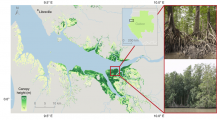
Globally the tallest mangrove forests in coastal Gabon are estimated up to 63 m. The photo insets show locations where individual trees were measured in situ up to 65 m tall (Simard et al., 2019).
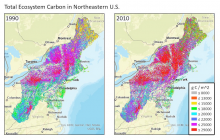
Estimated total ecosystem carbon for the northeast region of the U.S. for the years 1990 (left) and 2010 (right). The estimates were produced from an inventory-constrained version of the Carnegie-Ames-Stanford Approach (CASA) carbon cycle process model.
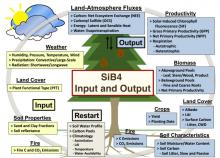
Overview of the Simple Biosphere Model (SiB4) that estimates carbon fluxes among the atmosphere, vegetation, and soils. Input information is shown in yellow boxes. These datasets include a selection of the output variables (blue boxes). Source: Haynes et al. (2020)
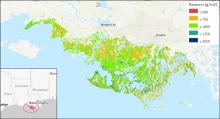
An area of the Mississippi River Delta (Terrebonne and St. Mary Parishes, LA, USA) showing the largest present-day amount of tidal vegetation biomass in the conterminous US. (Source Louisiana_biomass_2015.tif).
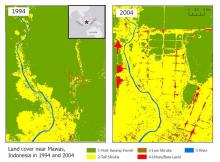
Land cover maps at 30 m resolution across Mawas, Central Kalimantan, Indonesia in 1994 (left) and 2004 (right).
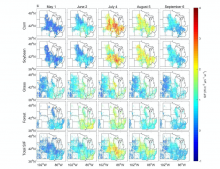
Examples of spatial patterns of reconstructed SIF at 4 km resolution. Only pixels with a fraction of the specific vegetation type larger than 0.1 are shown. For Total SIF, only pixels with a fraction of corn, soybean, grass/pasture, and forest larger than 0.8 are displayed.
Pantropical aboveground biomass density change from 2003 to 2016. Data have been aggregated to 5 km resolution for illustration.