Body
Data collected by the Airborne Oxygen Instrument (AO2) during the Atmospheric Tomography (ATom) airborne campaigns are now available.

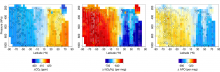
Example cross-sections of CO2, O2, and APO (O2 + 1.1 * CO2) measured by AO2 (interpolated flight track data) and the Medusa flask sampler (filled circles) during the Pacific southbound flights of ATom-4 in April and May 2018.
Data collected by the Airborne Oxygen Instrument (AO2) during the Atmospheric Tomography (ATom) airborne campaigns are now available.


The NASA DC-8 aircraft was used for the ATom missions.
Aerosol data collected during Atmospheric Tomography Mission (ATom) will inform on new particle formation occurrence in the tropics.

The Atmospheric Tomography (ATom) Mission is an Earth Venture Suborbital-2 mission to measure greenhouse gases and human-produced air pollution in remote areas.
Five new datasets from ATom provide measurements of greenhouse gases and human-produced air pollution from 2016 to 2018.
 Mission")
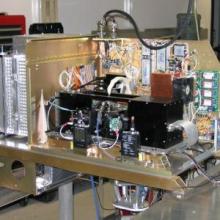
The NOAA Single Particle Soot Photometer (SP2) is a laser-induced incandescence instrument primarily used for measuring the black carbon mass content of individual particles.
Black carbon concentrations were measured over remote regions of the Earth during NASA's Atmospheric Tomography (ATom) Mission.


A NASA DC-8 taxis on the runway at Thule Air Base in Greenland. Credits: NASA/Kent Schiffer
Data collected by the Diode Laser Hygrometer (DLH) instrument during the Atmospheric Tomography (ATom) Mission is now available.


View of the DC-8 cockpit in flight. Credit: NASA/Michael Prather
Data collected by the Airborne Tropospheric Hydrogen Oxides Sensor (ATHOS) instrument during the Atmospheric Tomography (ATom) Mission is now available.


The ATom aircraft prepares to depart from Punta Arenas in southern Chile on October 14, 2017. During ATom-3, the science team flew over Antarctica and below the ozone hole before continuing on their journey north over the Atlantic Ocean to Greenland and returning to California.
Data collected by the Aerosol Microphysical Properties (AMP) instrument during the Atmospheric Tomography (ATom) Mission is now available.

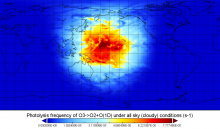
An image of photolysis frequency (J-value) for J-O1D under cloudy conditions from the GSFC GMI model.
Atmospheric photolytic rates for ozone and nitrogen dioxide were estimated using nine global chemistry-climate or chemistry-transport models.

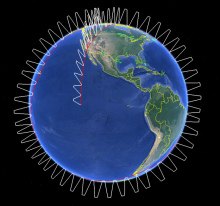
Generalized overview of ATom flights. During each of the four campaigns, ATom flights originated from California, flew south over the Pacific Ocean, then north to the western Arctic, southwest to New Zealand, east to Chile and the Atlantic Ocean, north to Greenland, and returned to California across North America. During flights, the aircraft continuously profiled the atmosphere from 0.2 to 12 km altitude.
The Atmospheric Tomography Mission (ATom) has released multi-instrument merged data from all four flight campaigns spanning from 2016 - 2018.

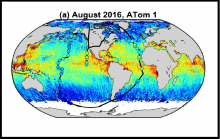
Circles mark the locations of the 139 selected profiles sampling the remote troposphere. Circle color indicates HCHO column densities integrated over each ATom profile. Data are overlain on global gridded OMI HCHO column densities averaged over the mission. From Wolfe et al. (2019) (see dataset references).
New data from NASA's Atmospheric Tomography Mission (ATom) provide hydroxyl and formaldehyde column density in the remote troposphere.
