Body
A new data set provides model source code for improved NO emissions from soil.

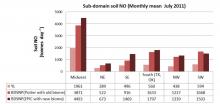
Soil nitric oxide emissions (tonnes/day) from three CMAQ parameterizations (from Rasool et al., 2016)
A new data set provides model source code for improved NO emissions from soil.
 from three CMAQ parameterizations (from Rasool et al., 2016)")
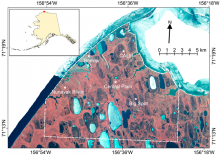
Google Earth Image of the locations of the four sites around Barrow, Alaska (from Fig. 1 in Schaefer et al., 2015).
A new data set provides estimates of Active Layer Thickness (ALT) and soil volumeteric water content (VWC) for Barrow, Alaska.
.")
![Mean daily daytime average CO2 concentration [ppm] in the boundary layer in June 2010 from the WRF model.](/sites/default/files/styles/media_library/public/field/image/CMS_WRF_Model_Products_Fig1.jpg?itok=0fMEuFMP)
Mean daily daytime average CO2 concentration [ppm] in the boundary layer in June 2010 from the WRF model.
New model outputs from the Penn State WRF-Chem version of the Weather Research and Forecasting (WRF) model estimate the hourly CO2 concentration in the atmosphere.
![Mean daily daytime average CO2 concentration [ppm] in the boundary layer in June 2010 from the WRF model.](/sites/default/files/styles/medium/public/field/image/CMS_WRF_Model_Products_Fig1.jpg?itok=rM4J6nSB "Mean daily daytime average CO2 concentration [ppm] in the boundary layer in June 2010 from the WRF model.")
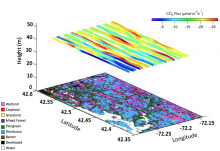
Fluxes of carbon dioxide observed during airborne sampling over the Harvard Forest site on June 1, 2014.
New data from NASA's Airborne Microwave Observatory of Subcanopy and Subsurface (AirMOSS) investigation examines carbon fluxes at Duke, Harvard, and Howland Forests.

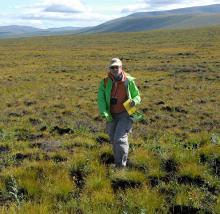
Dr. Nancy French walking a sampling transect at a burn site in Noatak National Preserve in the Alaskan tundra in August 2011. Image courtesy of Dr. Nancy French.
User highlight: Dr. Nancy French is Senior Scientist at Michigan Tech Research Institute and a contributing investigator to the ORNL DAAC.

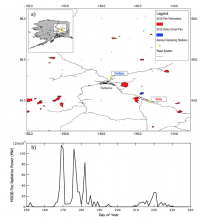
Figure (a) Map of the CARVE aerosol sampling stations in Alaska, (b) daily sum of fire radiative power from MODIS active fires in 2013 Alaska (from Mouteva et al 2015).
Carbon aerosol data was collected by NASA's Carbon in Arctic Reservoirs Vulnerability Experiment (CARVE) in summer 2013.
 Map of the aerosol sampling stations in Alaska, (b) daily sum of fire radiative power from MODIS active fires in 2013 Alaska (Mouteva et al 2015).")
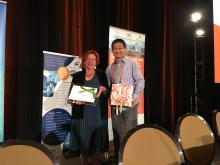
Sandy Harrison, chair of the WDS Scientific Committee, presenting award to ORNL DAAC's Dr. Yaxing Wei.
Dr. Yaxing Wei of the ORNL DAAC received the 2015 WDS Data Stewardship Award at SciDataCon 2016.

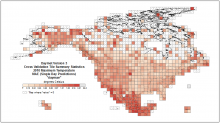
Daymet V3 cross-validation tile-wide summary statistics for 2010 maximum temperature. daymae: mean absolute error for single day predictions.
How accurate is Daymet? Cross-validation statistics for Daymet Version 3 are now available for each of the 2-degree by 2-degree tiles.

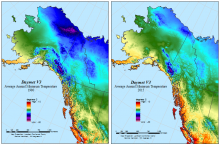
Daymet V3 average annual minimum temperature for 1980 and 2015 for a subset of the Daymet domain in Alaska and western Canada.
Annual and monthly climatologies for 1980-2015 for minimum and maximum temperature, precipitation, and vapor pressure are now available for Daymet V3.

Locations of approximately 7500 precipitation stations around the world in GHCN Version 1.
The GHCN data set contains monthly temperature, precipitation, sea-level pressure, and station-pressure data for thousands of meteorological stations worldwide from 1793 to 1990..
