Body
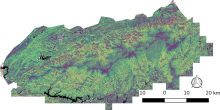
Land surface phenology dataset provides spatially explicit data related to the timing of phenological changes.

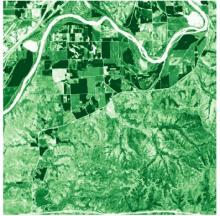
EVI amplitude at Konza Prairie Biological Station in 2019.
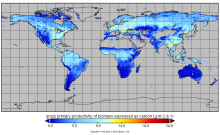
Gross primary production from FluxSat v2.0 expressed as carbon (g m-2 d-1) for July 1st, 2019.
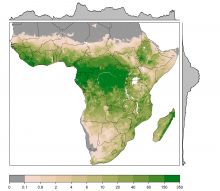
Estimates of woody biomass (tree and shrubs) at 1-km resolution in megagrams per hectare (Mg ha-1). Biomass was estimated from canopy cover, canopy height, and tree allometry. Source: C.W. Ross
Estimates of woody cover and biomass across sub-Saharan Africa were derived from observations, tree allometry equations, and remote-sensing products.
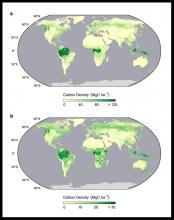
Global maps of above and belowground biomass carbon density: (a) aboveground biomass carbon density, (b) belowground biomass carbon density.
Temporally consistent and harmonized global maps of aboveground and belowground biomass carbon density are now available.

This overview map shows thirty unique vegetation canopy structure classes identified within the Great Smoky Mountain National Park in Tennessee and North Carolina, USA.
This revised dataset characterizes canopy structure based on LiDAR surveys of the Great Smoky Mountains National Park.

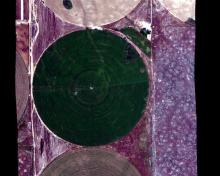
A portion of the quicklook image from flight line ang20150611t202652 over Reynolds Creek Experimental Watershed, Idaho on June 6, 2015. Center-pivot irrigation of agricultural land (1/2 mile in diameter) is visible in this image. Flight altitude was approximately 3000 m with clear weather.
A new dataset provides surface reflectance measured in 2014 & 2015 at long-term research sites in Idaho and California, USA.
 is visible in this image.")
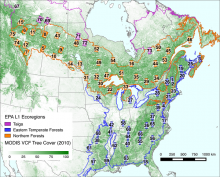
Spring and Autumn phenology was calculated for 75 Landsat sidelap regions. From Melaas et al., 2018.
A 30 year timeseries of spring and autumn phenology across North American forests was derived from Landsat imagery.

PhenoCam images from February and July 2013 at the Arbutus Lake site in New York.
Vegetation phenology observations and raw imagery from the PhenoCam network are now available from the ORNL DAAC.

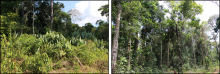
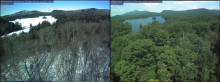
Photos of recovering burned (left) and unburned (right) sampling sites show vegetation changes due to burning and recovery of aboveground biomass after burning. Photos courtesy of I. Numata.
Data was collected to characterize the post-fire recovery of tropical forests in Acre, Brazil.

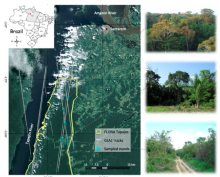
Location of the Tapajos National Forest, PA, Brazil, outlined in yellow. The gray lines are GLAS sampling flight tracks from 2003 to 2009 and the blue circles are the forest plots sampled. The pictures on the right illustrate three of the stands where plots were located (Goncalves et al., 2017).
Forest inventory data from the Tapajos National Forest in Brazil were used to calibrate GLAS LiDAR estimates of forest biomass.
