Body
NASA's ABoVE campaign provides year-round CO2, CH4, and meteorology at five sites on Alaska's North Slope.

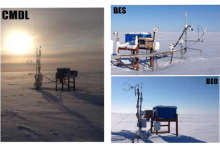
Three tower sites at Barrow, Alaska: Barrow Environmental Observatory (BEO) tower, Biocomplexity Experiment, South (BES) tower, and the Climate Monitoring and Diagnostics Laboratory (CMDL) tower.
NASA's ABoVE campaign provides year-round CO2, CH4, and meteorology at five sites on Alaska's North Slope.
 tower, Biocomplexity Experiment, South (BES) tower, and the Climate Monitoring and Diagnostics Laboratory (CMDL) tower.")
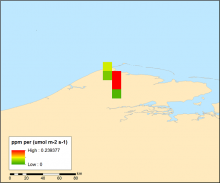
Plot of the 0.1 degree gridded STILT footprint model output for August 15, 1982 near the receptor location at Barrow, Alaska. This variable provides 24 hours of surface influence representing the response of the receptor to a unit surface emission (ppm/umol m-2 s-1) of CO2 in each grid cell within a small region close to the measurement location. (From the data file foot1982x08x15x06x00x71.3230Nx156.6114Wx00016.nc)

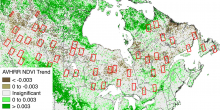
Sites used in this study are shown with AVHRR NDVI trends from Beck and Goetz (2011). Figure from Sulla-Menashe et al. (2018)
A new ABoVE dataset provides a 28-year time series of peak greenness data derived from Landsat 5 TM imagery over the Boreal forest region of Canada.

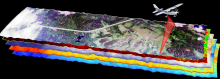
Hyperspectral imagery captured for ABoVE during a flight of the AVIRIS-NG instrument over the Alaskan Arctic.
Surface reflectance was measured along more than 400 flight lines during the intensive 2017 ABoVE airborne campaign.

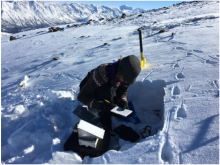
Measurement of snowpack characteristics and track sink depths at a Dall sheep (Ovis dalli dalli) track site in March 2017 on Jaeger Mesa, Wrangell St. Elias National Park and Preserve, Alaska (from Sivy et al., 2018).
Research from NASA's ABoVE campaign examines how snow characteristics may affect populations of Dall sheep.
 track site in March 2017")
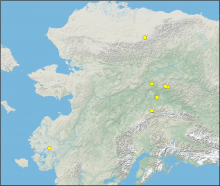
Locations of thaw depth measurement sites. Three of the locations are paired unburned-burned sites.
New data from ABoVE provide thaw depth at burned and unburned sites across Alaska.

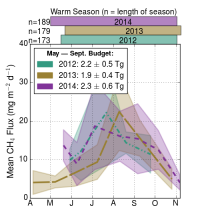
Monthly mean CH4 flux estimates for Alaska. Values are centered on the mean measurement date for a given month and the shaded regions are the standard error of the mean (figure from Hartery et al. 2018).
A new dataset from NASA's Carbon in Arctic Reservoirs Vulnerability Experiment (CARVE) provides gridded methane flux estimates from 2012-2014.

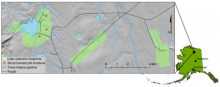
Location of Toolik Lake study area in northern Alaska. Detail view shows three LiDAR collection footprints in pale green. Red crosses indicate locations of shrub harvest areas within the Toolik LiDAR footprint (figure from Greaves et al., 2016).
LiDAR and orthophotography were used to estimate aboveground shrub biomass near Toolik Lake, AK.

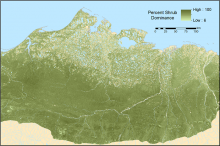
The best estimate (50th percentile) of 30-m shrub dominance (shrub/plant AGB) for non-water portions of the Beaufort Coastal Plain and Brooks Foothills ecoregions of the North Slope of Alaska.
Estimates of aboveground biomass for the North Slope of Alaska are provided in a new dataset.

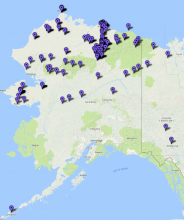
Vegetation, soil, and environmental data were collected from over 3400 plot locations in the ABoVE study area.
Vegetation species and other environmental and soil parameters are available from over 3400 plot locations within the NASA ABoVE study domain.
