Body
Annual pan-Arctic tundra greenness and summer air temperatures at 50 km spatial resolution.

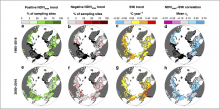
Tundra greenness and summer air temperature trends and correlations across the pan-Arctic. Source: Berner et al., (2020)
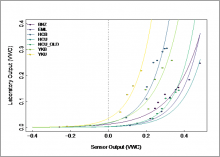
Site-specific soil moisture sensor calibration curves. Laboratory determined volumetric water content (VWC) is plotted against the raw VWC sensor output
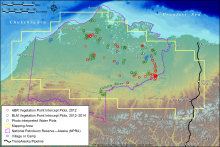
Map of quantitative-cover mapping area showing the distribution of field plots, North Slope, Alaska. Source: Macander et al., 2017
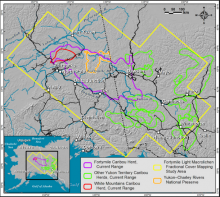
Map of eastern Alaska and Yukon showing Fortymile Study Area footprint and caribou herd range boundaries. Source: Macander et al., 2020
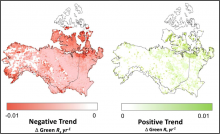
Lakes with significant negative trends in "greenness" of lake surface reflectance (left) and positive trends (right) across growing seasons from 1984-2019 below 75 degrees N. Source: Kuhn and Butman, 2021
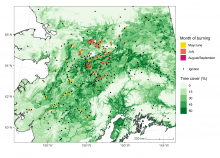
Ignition locations and burned area for Interior Alaska in 2015.
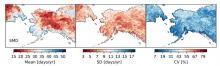
Descriptive statistics for snow melt duration (SMD) for the period 1988-2016, including mean, standard deviation, and coefficient of variation. Units are the number of days per year.
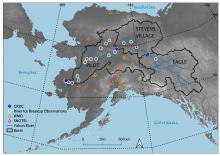
Spatial extent of snowpack main melt onset dataset (MMOD) extending from the Russian Far East across Alaska into Canada's Northwest Territories and British Columbia. Source: Pan et al. (2021)
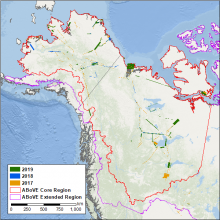
ABoVE flight paths of the AVIRIS-NG instrument during 2017, 2018 and 2019.
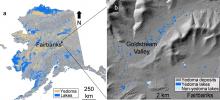
Location of the study area northwest of Fairbanks, AK, USA. The map shows (a) yedoma permafrost distribution and (b) yedoma lakes and terrain of the Goldstream Valley. Data sources include Strauss et al. (2016), Alaska LiDAR Dataset (USGS, 2018), Elevation Datasets of Alaska (DGGS Staff, 2013), and Walter Anthony et al. (2020).