Body
This dataset provides estimates of methane (CH4) emissions from dairies in California at a resolution of 0.1 degrees (~ 10 km x 10 km) for the year 2019.

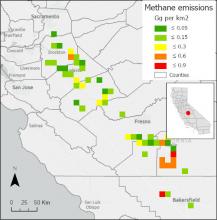
Total methane emissions from dairy farms in the central valley of California, USA, in 2019.
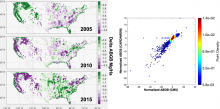
ABGB outputs over CONUS derived from CARDAMOM vs. the CMS project-funded ABGB estimated from inventory and satellite data (Yu et al., 2021). The left panel shows the colormaps of differences between ABGB from CARDAMOM and ABGB from CMS for the years 2005, 2010, and 2015. The right panel is the scatter plot showing the pixel-level ABGB deviations from the 1:1 line for CARDAMOM- and CMS-derived outputs.
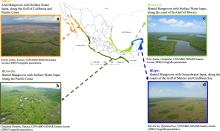
Categories of persistent mangrove forests on the coasts of Mexico.
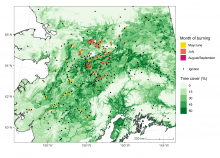
Ignition locations and burned area for Interior Alaska in 2015.
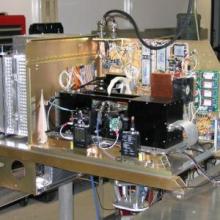
The NOAA Single Particle Soot Photometer (SP2) instrument.
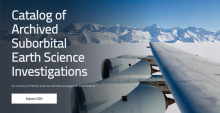
An inventory of NASA's airborne and field campaigns for Earth Science.
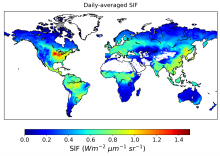
Daily-corrected SIF at 740 nm for August 2015. The highest SIF values during this time period were observed in agricultural sectors in the Northern Hemisphere.
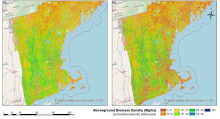
30 m resolution maps of aboveground biomass density (AGBD) over the New England region in 2015. a) The mean of the posterior distribution sampled from a Markov chain Monte Carlo (MCMC) model. b) The AGBD estimate over an entire pixel adjusted by canopy cover (i.e., AGBD multiplied by canopy cover percentage). Source: Tang et al., 2021

Please join us at the 2021 Ecological Society of America: Vital Connections in Ecology Meeting, August 2-6, 2021.
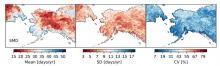
Descriptive statistics for snow melt duration (SMD) for the period 1988-2016, including mean, standard deviation, and coefficient of variation. Units are the number of days per year.