Body
Extensive data from field surveys at the Toolik Lake research site, located in the foothills of the Brooks Range, Alaska, are now available.

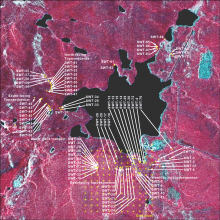
Location map of the 81 Toolik Lake Permanent Vegetation Plots.
Extensive data from field surveys at the Toolik Lake research site, located in the foothills of the Brooks Range, Alaska, are now available.

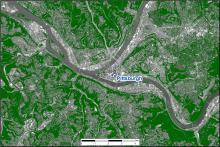
Estimated tree canopy cover (in green) near Pittsburgh, Pennsylvania, for the year 2008.
Data from NASA'S Carbon Monitoring System (CMS) provides high-resolution tree canopy cover for the state of Pennsylvania.
 near Pittsburgh, Pennsylvania, for the year 2008.")
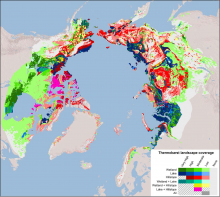
Dominant or co-dominant thermokarst landscapes within the northern boreal and tundra circumpolar permafrost region (from Olefeldt et al., 2016).
A new dataset provides the distribution of Arctic thermokarsts and estimates of soil organic carbon in those landscapes.
.")
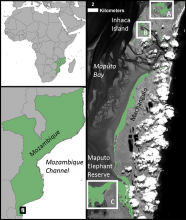
Location of study sites on Inhaca Island (A and B) and Maputo Elephant Reserve (C) in southern Mozambique. From Lagomasino et al. (2015).
A new dataset provides high-resolution canopy height estimates for three mangrove forests in Mozambique.
 and Maputo Elephant Reserve (C) in southern Mozambique. From Lagomasino et al. (2015).")
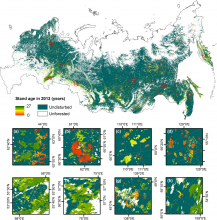
Distribution of young forests across Russia. Insets (a-h) show a closer view of stand age at eight selected sites. From Loboda and Chen (2016).
A new data set provides the spatial distribution of young forests (stand age < 27 years) in Russia as of 2012.
 show a closer view of stand age at eight selected sites. From Loboda and Chen (2016).")
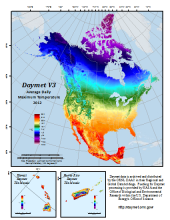
Daymet V3.0 2012 Average Daily Maximum Temperature for North America, Hawaii, and Puerto Rico
The new version of Daymet data includes an expanded North American spatial extent including Canada, the United States (including Alaska), Mexico, Puerto Rico, and Hawaii.

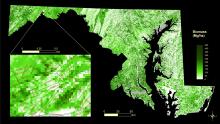
Aboveground biomass (Mg ha-1) at 30-m resolution for the state of Maryland, 2011. Areas in grey (value = -1) indicate gaps in LiDAR coverage.
A new data set from NASA's Carbon Monitoring System provides high-resolution biomass estimates for the state of Maryland.
 at 30-m resolution for the state of Maryland, 2011. Areas in grey (value = -1) indicate gaps in LiDAR coverage.")
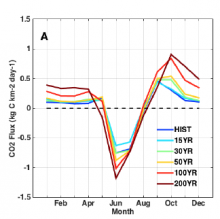
CLM4.5 modeled annual land-atmosphere CO2 flux in Alaska under future warming and permafrost thaw scenarios (from Parazoo et al., 2016).
Satellite and airborne observations of CO2 flux were used to simulate present and future CO2 flux.
.")
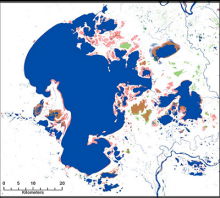
Lake Claire (Canada) as a difference map from 1991 to 2011. Water for 1991-2011 is shown in blue, green 2011, brown 2001, and red is water in 1991.
A new ABoVE dataset provides a map of surface water in the Boreal and Tundra regions of North America in 1991, 2001, and 2011.
 as a difference map from 1991 to 2011. Water for 1991-2011 is shown in blue, green 2011, brown 2001, and red is water in 1991.")
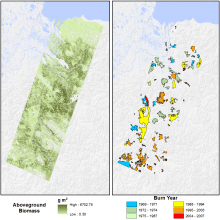
Kolyma River Basin study area maps: (L) Cajander larch aboveground biomass; (R) burn scar perimeters from fires circa 1966-2007 (Berner et al., 2012).
A new dataset provides maps of aboveground biomass and burn perimeters for 116 forest fires in Siberia.
 Cajander larch aboveground biomass; (R) burn scar perimeters from fires circa 1966-2007 (Berner et al., 2012).")