Body
The Daymet website will update from http to https on 2015-11-19, following NASA’s plan of action.

Visit the Daymet home page to order gridded estimates of daily weather parameters for North America.
The Daymet website will update from http to https on 2015-11-19, following NASA’s plan of action.

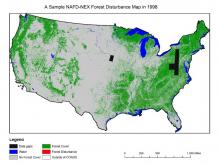
NAFD -NEX forest disturbance map for the year 1988.
A new data set provides 25 annual and two time-integrated forest disturbance maps for the conterminous United States: 1986-2010.
")
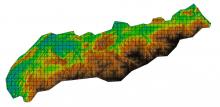
1.5-meter resolution digital elevation model for the Tennessee Great Smoky Mountains National Park. LiDAR tiles are represented by grid overlay.
LiDAR-derived vegetation canopy structure for the Tennessee part of the Great Smoky Mountains National Park (GSMNP) is provided in a new data set.

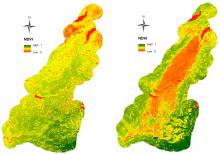
NDVI from MASTER surveys of King Fire area on 09/19/2013 and 11/17/2014.
The Rim Fire occurred in the Stanislaus National Forest and Yosemite National Park in the Sierra Nevada Mountains, California in August of 2013. The King Fire occurred in El Dorado County in the Sierra Nevada Mountains, California in September of 2014.

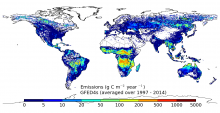
Annual carbon emissions (as g C/m2/year) averaged over 1997-2014.
GFEDv4, a database of monthly fire emissions, burned area, and emissions by specific fire source is now available.
 averaged over 1997-2014.")
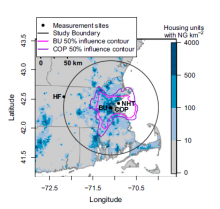
Locations of two city (Boston University (BU), Copley Square (COP),) and two peripheral (Harvard Forest (HF); Nahant (NHT)) measurement stations in Boston and the surrounding area.
How much methane is emitted by natural gas infrastructure in a major city?
, Copley Square (COP),) and two peripheral (Harvard Forest (HF); Nahant (NHT)) measurement stations (black points) in Boston, and the surrounding area.")
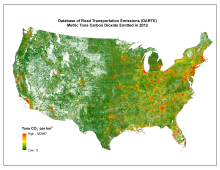
Tons of CO2 emitted from vehicles in 2012 from the Database of Road Transportation Emissions.
A new CMS data set provides annual on-road CO2 emissions for the conterminous United States.

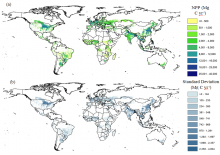
Net primary production (NPP) (a) and associated standard deviation (b) for global croplands in year 2009 at 0.05 degree resolution.
Spatially-explicit, global estimates of carbon fluxes from crops and biomass harvest are available in a new data set.
 (a) and associated standard deviation (b) for global croplands in year 2009 at 0.05 degree resolution")
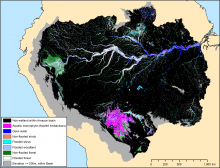
Wetlands of the lowland Amazon basin, mapped during May - June 1996 (high water stage).
A newly published map presents wetland extent, vegetation type, and dual-season flooding state of the entire lowland Amazon basin.
.")
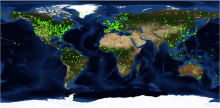
Locations of the 1,100+ field sites with available 7 x 7-km MODIS land product subsets.
Subset and visualize MODIS collection 5 land products using the MODIS fixed sites and Web service tools.
