Body
Water surface elevations at selected point locations generated from the AirSWOT data collected during the Spring and Fall 2021 Delta-X deployments over the Atchafalaya and Terrebonne basins in LA, USA.

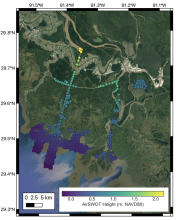
AirSWOT L3 water surface elevations collected on April 1, 2021 over the Atchafalaya Basin. Each point is colored based on its elevation with respect to the NAVD88 vertical datum (GEOID12B), as shown in the colorbar.
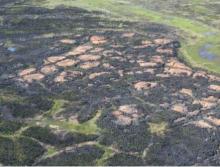
The 2007 Anaktuvuk River fire burned across riparian stringers and wet channels around high-centered polygons that are typically left as unburned inclusions. (2008 photo by D. Yokel). Source: Jandt et al., 2012.
Delta-X is a 5-year NASA Earth Venture Suborbital-3 mission to study the subsidence and growth of the Mississippi River Delta in the United States.
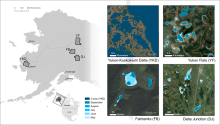
Four subregions of Alaska (left) with example of lakes and ponds derived from PlanetScope imagery (right). Lake and pond extents include monthly climatological composites (May - September) and 3-year composites for 2019-2021. The inset for the Fairbanks (FB) region shows a close-up of the water extents overlain on sub-meter Esri base map imagery. The Yukon Flats (YF) inset shows variability in surface area of large lakes. The Delta Junction (DJ) inset shows seasonal changes in the area of small ponds. The Yukon-Kuskokwim Delta (YKD) inset shows the spatial variability of water body areas in this region and is an example of a 3-year composite.
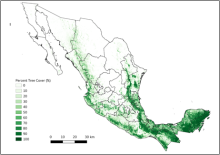
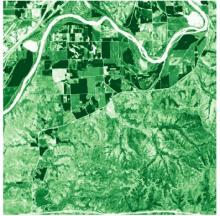
Multi-year mean (2016-2018) of percent tree cover maps for Mexico.
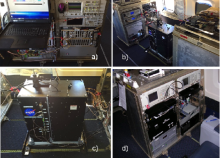
CO2 Sounder instrument photographs. a) The aircraft rack with the new seed laser subsystem. b) The aircraft racks containing the laser power amplifiers and the lidar's detector subsystem. c) The lidar's transmitter and receiver telescope assembly, which is positioned over the nadir window assembly in the aircraft fuselage. The optical pulses from the fiber amplifiers, and the received optical signals are coupled via fiber optics. d) The instrument operator's console, with the control computer screens folded away (Abshire et al., 2018).
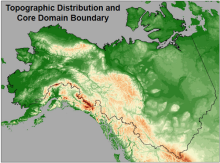
The topographic distribution and core domain boundary of the ABoVE study area (image is from Liston and Reinking, 2022).
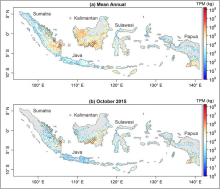
Spatial patterns of the (a) mean annual total particulate matter (TPM) from fire emissions during fire seasons from 2015 to 2020 and (b) TPM from fire emissions in October 2015 across Indonesia. Areas marked with green lines represent peatland areas. Source: Lu et al. (2022).
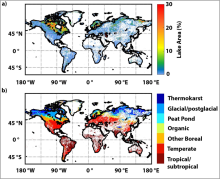
a) Lake area density (fraction of cell area) and b) ecoclimatic lake type classification. White space indicates cells with no lakes present.
EVI amplitude at Konza Prairie Biological Station in 2019.