Body
Estimates of mangrove loss, land cover change, and its anthropogenic or climatic drivers 2000-2005, 2005-2010, and 2010-2016.

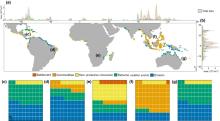
Global distribution of mangrove loss and its drivers. (a) The longitudinal distribution of total mangrove loss and the relative contribution of its primary drivers. Different colors represent unique drivers of mangrove loss. (b) The latitudinal distribution of total mangrove loss and the relative contribution of its primary drivers. (c-g) Global distribution of mangrove loss and associated drivers from 2000 to 2016 at 1-degree x 1-degree resolution, with the relative contribution (percentage) of primary drivers per continent: (c) North America, (d) South America, (e) Africa, (f) Asia, (g) Australia together with Oceania.
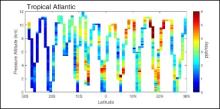
Curtain plot for production of ozone from the ATom-1 campaign in the Atlantic. The 10 s air parcels are averaged into 10-degree latitude and 200 m altitude bins. Reactivities, such as P-O3, are calculated for each 10 s air parcel from the Modeling Data Stream (MDS), Version 2, using the UC Irvine chemistry-transport model (CTM) with HNO4 and PAN damped by thermal decomposition.
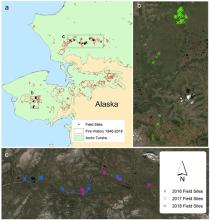
Locations of field sites in Alaska, U.S.
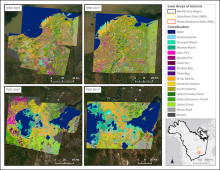
Classified wetland type maps for the Slave River Delta (SRD) and Peace-Athabasca Delta (PAD), Canada circa 2007 and circa 2017.

The Washington Post is an American daily newspaper founded in 1877 and published in Washington, D.C. with a large international audience.
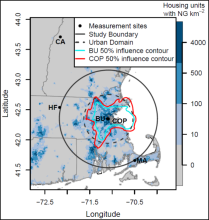
Map of measurement stations in the Boston network. The black line demarcates the 90 km radius circle in which emissions were optimized and the dashed line bounds the urban domain for study. The blue shading represents the number of housing units with natural gas per square kilometer. The red and blue contour encloses 50% of the average footprint initiated at the COP and BU sites, respectively.

View from the front of the NASA DC-8 aircraft during the ATom-1 campaign.
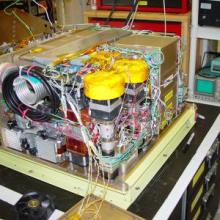
Photo of the interior of the PANTHER GC. This instrument was used during all ATom campaigns.
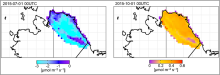
TVPRM net ecosystem exchange: Surface upward mass flux of carbon dioxide expressed as carbon due to emissions from natural sources for 2015-07-01 (left) and 2015-10-01 (right).
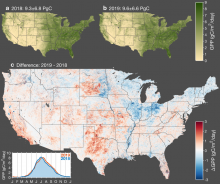
Interannual variation in gross primary productivity (GPP) across conterminous United States. Map of annual mean GPP for 2018 (a) and 2019 (b). Map of the difference in annual mean GPP between 2019 and 2018 (c) wherein red indicates higher GPP in 2019 and blue indicates higher GPP in 2018. The inset in the bottom left corner shows a time series of the average GPP across CONUS for 2018 and 2019.