Body
Cloud type and coarse aerosol contents measured by the University of Vienna's CAPS instrument during ATom campaigns from 2016 to 2018.

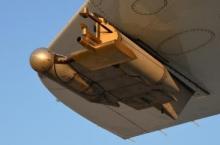
The CAPS instrument attached to the exterior of the NASA DC-8 aircraft.
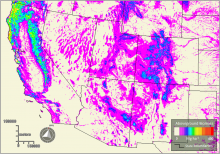
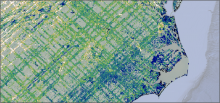
Generalized 2005 MISR-derived AGB map for the southwestern U.S., one in the series for 2000-2021.
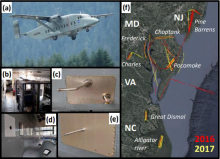
The CARAFE payload. (a) The NASA C-23 Sherpa. (b) A view inside the cabin with all instruments installed. (c) The angle-of-attack (upper) and total air temperature (lower) probes. (d) The DLH window plate (upper left) and fairing-mounted target (lower right). (e) GHG inlet. (f) Flux leg flight tracks for both campaigns.

NASA's GEDI observable is the lidar waveform, all products are derived from it.
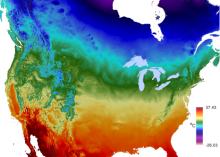
Average maximum temperature for a 24-hour period over an annual period.
This screen capture from the GEDI L4B mean aboveground biomass density layer shows the crisscross pattern of GEDI's laser tracks on the Earth's terrestrial surface.

A screenshot of the NASA Earthdata Forum landing page.

Transitioning from MODIS to VIIRS to ensure data product continuity. Image Credit: NASA ESDIS Outreach Team.
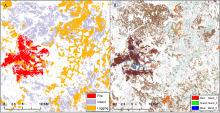
Casual agents of disturbance for the year 2006 in the ABoVE domain for tile BH19V15 (A) with the Tasseled Cap change (dTC) image in the same year for the same region (B). In the dTC image, Band_1 is change in brightness; Band_2 is change in greenness; Band_3 is change in wetness. The pixel resolution is 30 meters.
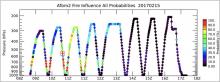
Fire influences for air parcels on the ATom-2 research flight that occurred on 2017-02-15.