Body
A new Learning Resources Page is now available to provide user support for ORNL DAAC products and services.


A new Learning Resources Page is now available to provide user support for ORNL DAAC products and services.

MODIS Landcover MCD12Q1 Collection 6 is now available via the MODIS Web Service. ORNL DAAC recently updated its MCD12Q1 inventory from Collection 5 to Collection 6.
Dr. Koen Hufkens released an update to the MODISTools R package. The package enables users to download MODIS data to their workspace via the MODIS API.
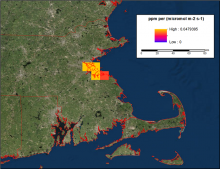
Estimated surface influence on the carbon dioxide concentration at a receptor in Boston, Massachusetts (ppm/umol m-2 s-1).
Modeled footprint products estimate the influence of upwind surface fluxes on observed carbon dioxide and methane concentrations.

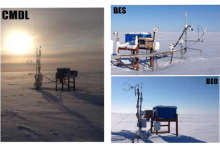
Three tower sites at Barrow, Alaska: Barrow Environmental Observatory (BEO) tower, Biocomplexity Experiment, South (BES) tower, and the Climate Monitoring and Diagnostics Laboratory (CMDL) tower.
NASA's ABoVE campaign provides year-round CO2, CH4, and meteorology at five sites on Alaska's North Slope.
 tower, Biocomplexity Experiment, South (BES) tower, and the Climate Monitoring and Diagnostics Laboratory (CMDL) tower.")
This data tutorial shows how to place bulk orders for multiple locations or multiple products at once using the MODIS Global Subsets Tool and the recently released MODIS REST API .
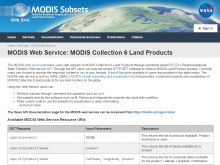
MODIS Web Services offered by the ORNL DAAC
A new RESTful Application Interface (API) has been released for the ORNL DAAC MODIS Web Service.

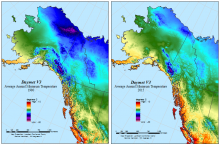
Daymet V3 average annual minimum temperature for 1980 and 2015 for a subset of the Daymet domain in Alaska and western Canada.
Daymet V3 annual and monthly climatologies for minimum and maximum temperature, precipitation, and vapor pressure have been updated to include year 2017.

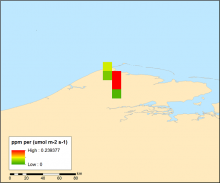
Plot of the 0.1 degree gridded STILT footprint model output for August 15, 1982 near the receptor location at Barrow, Alaska. This variable provides 24 hours of surface influence representing the response of the receptor to a unit surface emission (ppm/umol m-2 s-1) of CO2 in each grid cell within a small region close to the measurement location. (From the data file foot1982x08x15x06x00x71.3230Nx156.6114Wx00016.nc)

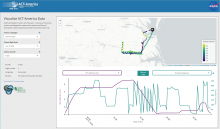
Aircraft altitude and heading for the B-200 aircraft during a flight on July 11, 2016 as shown by the ORNL DAAC Airborne Data Visualization.
Conditions recorded by ACT-America flights over Eastern North America are presented in a new dataset.
