Body
Lab-measured soil properties, including soil water matric potential, soil dielectric properties, soil electrical conductivity, corresponding soil moisture.

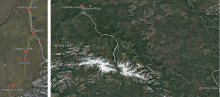
Site locations. (a) in Northern Slope Alaska. (b) Central region of Alaska.
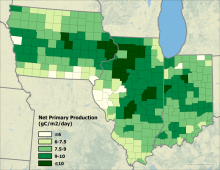
Model-estimated net primary production over the study area on July 18, 2018.
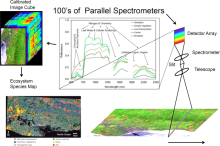
Overview of AVIRIS-NG applications, source: https://avirisng.jpl.`nasa.gov/aviris-ng.html .
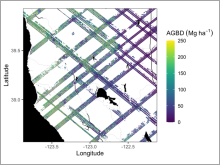
Example subset of aboveground biomass density (AGBD; Mg ha-1) predictions from the GEDI Level-4A footprint product over Northern California, U.S., spanning April to July 2019. GEDI footprints are spaced 60m along-track and 600m across-track.
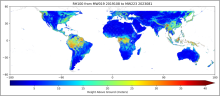
Level 3 estimated canopy height in meters derived from the Level 2 profile metric RH100 between the 19th and the 223rd mission week. Source: GEDI03_rh100_mean_2019108_2023081_002_05.tif
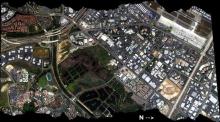
RGB composite image from AVIRIS-Classic flight f060510t01p00r06 on May 10 2006 over Irvine, California.
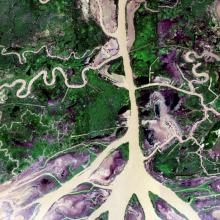
A BRDF and sunglint-corrected image of the Atchafalaya basin.
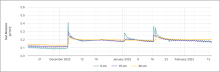
Root zone soil moisture at 5, 15, and 30 cm depth for a node in Lucky Hills, AZ.
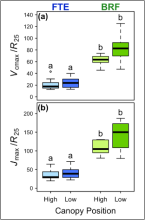
Ratios of (a) maximum rate of carboxylation to respiration at 25 degrees C from Griffin et al. (2022) (Vcmax /R25 ) and (b) maximum electron transport rate to respiration at 25 degrees C from Griffin et al. (2022) (Jmax /R25 ) of white spruce from high and low canopy positions at the Forest Tundra Ecotone (FTE, blue), Alaska, and Black Rock Forest (BRF, green), New York. Boxplots show the median and first and third quartiles. Whiskers display the range of groups with individual points representing outliers falling outside 1.5 times the interquartile range. Different letters represent significant differences between locations and canopy positions.
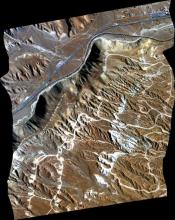
RGB composite image from AVIRIS-Classic flightline f170628t01p00r04 acquired on June 28 2017 northwest of Mojave, California.