Body
An updated version of the standard reference grid for NASA's ABoVE campaign has been released.

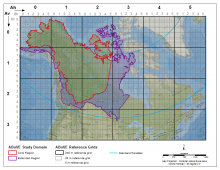
The ABoVE Study Domain with Core and Extended study regions and the Standard Reference Grid showing the nested 240 and 30 meter tiling scheme.
An updated version of the standard reference grid for NASA's ABoVE campaign has been released.

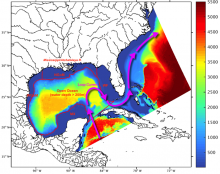
Domain of the South Atlantic Bight and Gulf of Mexico (SABGOM) model showing water depth (m). For analysis, the Gulf was divided into five subregions used in this study, which are Mexico Shelf (MX), Western Gulf of Mexico Shelf (WGoM), Northern Gulf of Mexico Shelf (NGoM), West Florida Shelf (WF), and open ocean. Arrows indicate the Loop Current (figure from Xue et al., 2016).
Output from the South Atlantic Bight and Gulf of Mexico (SABGOM) model provides insight into biogeochemical cycling and three-dimensional ocean circulation in a gulf-wide context.
 model")
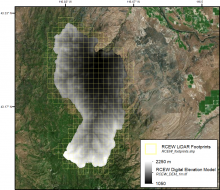
Digital elevation model and LiDAR tile boundaries for the area encompassing the Reynolds Creek Experimental Watershed in southwestern Idaho.
LiDAR data collected over southern Idaho was used to derive a high resolution digital elevation model and map of vegetation height across a strong regional climate gradient.

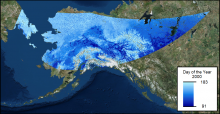
Date of last spring snow cover for portions of Alaska and the Yukon Territory in 2000. Data spatial extent is based on the MODIS sinusoidal projection.
Data from NASA's ABoVE campaign tracks the last day of spring snow cover for parts of Alaska and the Yukon Territory annually from 2000 through 2016.

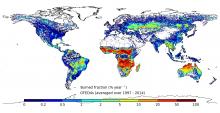
Annual burned area (as percentage of the area of the grid cell), averaged over 1997-2014
A new version of the GFED data provides global fire and emissions data from 1997 to 2016.

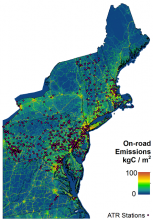
Map of Automatic Traffic Recorder (ATR) station locations used to temporally downscale DARTE annual FFCO2 emissions from the on-road sector to hourly ACES emissions. Background color shows annual total emissions in ACES for the on-road sector in 2011 (Figure S5, Gately and Hutyra, 2017).
Data from NASA's Carbon Monitoring System provides estimates of CO2 emissions from the combustion of fossil fuels for the Northeastern United States.

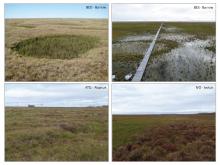
Land cover types and topography at the flux tower field sites at Barrow, Atqasuk, and Ivotuk, Alaska
Historical data from the ABoVE project characterize vegetation within five flux tower footprints in Alaska.

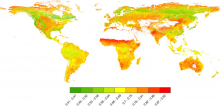
Global map of MODIS-derived clumping index in 2006 (from He et al. 2012). Clumping index values range from 0 to 1 (maximum clumping to minimum clumping) representing the degree of foliage grouping within distinct canopy structures, such as tree crowns, shrubs, and row crops, relative to a random distribution.
A new dataset provides a high-resolution global clumping index derived from MODIS.

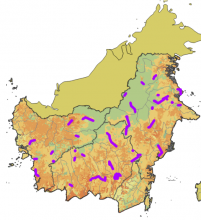
The 2014 LiDAR campaign covered 90 survey sites and approximately 100,000 hectares across the Indonesian portion of the island of Borneo (from Hagen 2015).
NASA's Carbon Monitoring System collected LiDAR data from Indonesia as part of a national forest carbon inventory.

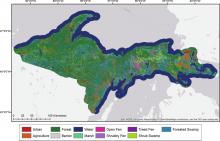
Peatland type map for the upper peninsula of Michigan (from Bourgeau-Chavez et al. 2017).
Researchers used multi-sensor fusion techniques to map peatland ecosystems in the upper peninsula of Michigan.
