Body
The lead developer of Daymet is recognized as a highly cited author in 2019.


Dr. Peter Thornton leads the Modeling and Scale Integration Science Team for the Next-Generation Ecosystem Experiments (NGEE) Arctic project.
The lead developer of Daymet is recognized as a highly cited author in 2019.

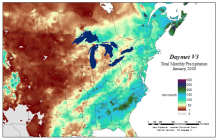
Daymet V3 total precipitation for January 2000 for a subset of the Daymet domain in eastern North America.
The ORNL DAAC has released a correction to “Daymet Monthly Climate Summaries on a 1-km Grid for North America, Version 3."


Asclepias syriaca (common milkweed) relies on pollinators for movement of its pollen, and evidence suggests that its populations are declining. Image courtesy of Pixabay.
Daymet daily surface weather and climatological summaries have been cited in nearly 300 peer-reviewed articles. Read about how this popular data product is used in research.
 flower.")

The Land Processes DAAC distributes NASA Earth Observing System data. They developed the AppEEARS tool to provide access to a wide range of data from instruments including MODIS, VIIRS, SMAP, and now Daymet.
Daymet Version 3 daily weather data for North America is now available through the AppEEARS subsetting tool from NASA's Land Processes DAAC.

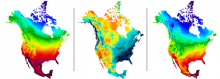
Daymet provides high-resolution surface meteorology data for North America. The figure shows annual data for the year 2018; Left: Mean maximum daily temperature, Middle: Total precipitation, Right: Mean minimum daily temperature. Daymet data is archived and distributed by the ORNL DAAC.
Daymet weather and climate data for North America are now available for the years 1980 - 2018.

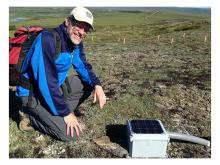
Oak Ridge National Lab Distinguished Researcher Peter Thornton in the field.
The lead developer of Daymet receives recognition as a highly cited author.

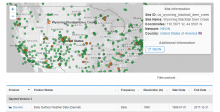
A site within the National Ecological Observatory Network demonstrates that Daymet data can now be accessed using the Fixed Sites Subsets Tool.
For study sites in North America, Daymet daily weather data is now provided alongside pre-processed MODIS and VIIRS data subsets.

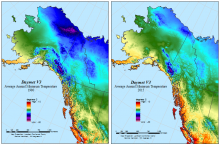
Daymet V3 average annual minimum temperature for 1980 and 2015 for a subset of the Daymet domain in Alaska and western Canada.
Daymet V3 annual and monthly climatologies for minimum and maximum temperature, precipitation, and vapor pressure have been updated to include year 2017.

Daymet single pixel downloads in the vicinity of Yellowstone National Park, USA, accessed the week of August 14, 2017.
Daymet now includes gridded climate data through year 2017 and a redesigned data extraction tool.
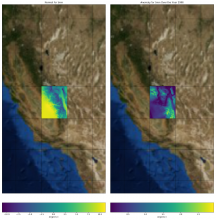
Climate anomaly (right panel) in minimum daily temperature for year 1990 compared to the long-term normal (left panel). The climate normal and anomaly were calculated for a single 2-degree tile from the Daymet dataset.
New Jupyter notebook tutorials show how to access and visualize Daymet climate data from within Python and how to calculate climate normals and anomalies.
