Body
Statewide tree canopy cover at 1m resolution is now available for Maryland and Delaware.

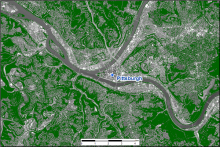
Estimated tree canopy cover (in green) near Pittsburgh, Pennsylvania, for the year 2008.
Statewide tree canopy cover at 1m resolution is now available for Maryland and Delaware.

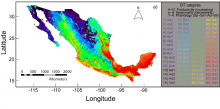
Spatial distribution of 64 ecosystem functional type (EFT) categories across Mexico. For each pixel, the dominant EFT is reported.
New data from the Carbon Monitoring System classifies Mexico's ecosystems based on their ecosystem functioning.

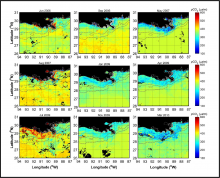
Monthly composite images of satellite-derived pCO2 for the northern Gulf of Mexico, corresponding to each of the cruises for which observational data were acquired. Black pixels in the images correspond to areas that were masked (e.g., land, clouds), and the dotted lines represent the 45 and 200 m isobaths.
Monthly estimates of ocean surface pCO2 and air-sea flux of CO2 are available from NASA's Carbon Monitoring System.

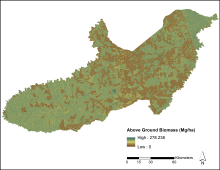
Assimilated predictions of forest aboveground biomass across the Paragominas Municipality, Brazil.
Estimates of forest aboveground biomass for the Paragominas municipality, in Para, Brazil, were derived from LiDAR and PALSAR data.

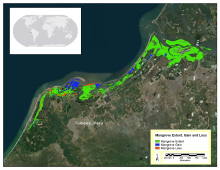
Map of a portion of Peruvian coast showing areas of mangrove extent, gain, and loss from the year 2000 to 2016.
Maps of mangrove forest extent and change is available for river deltas in six countries: Gabon, Jamaica, Mozambique, Peru, Senegal, and Tanzania.


Dr. Lucy Hutyra, Associate Professor of Earth & Environment, Boston University, Boston, MA
Dr. Lucy Hutyra uses NASA data to study the cycling of carbon, especially in urban environments.

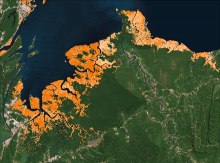
Heights of mangrove forests along the northern coast of Borneo (countries Brunei and Malaysia) reach 39 meters tall. Mangrove cover is illustrated in orange, where darker orange represents taller canopies.
Maps of the global distribution and biomass of mangrove forests are available for 116 countries.

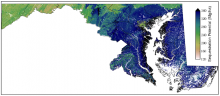
Carbon sequestration potential within the state of Maryland, defined as 95% of maximum forest aboveground biomass (Mg/ha), simulated after 500 years of succession.
A new dataset maps the aboveground biomass of Maryland's forests and estimates their potential for future carbon sequestration.

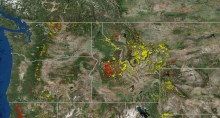
The webinar featured data on the locations of forest disturbance by fire (red) and insect infestation (yellow) across northwestern USA between 2006 and 2010.
The recording of our NASA Earthdata webinar on "Introduction to Geospatial Analysis in R" is now available.

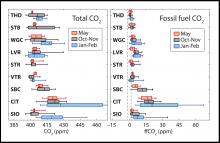
Seasonal quartiles of total CO2 concentrations and fossil fuel CO2 concentrations for each of the nine observation sites in California, 2014-2015.
A new dataset provides estimates of CO2 emissions from fossil fuels across California in 2014-2015.
